

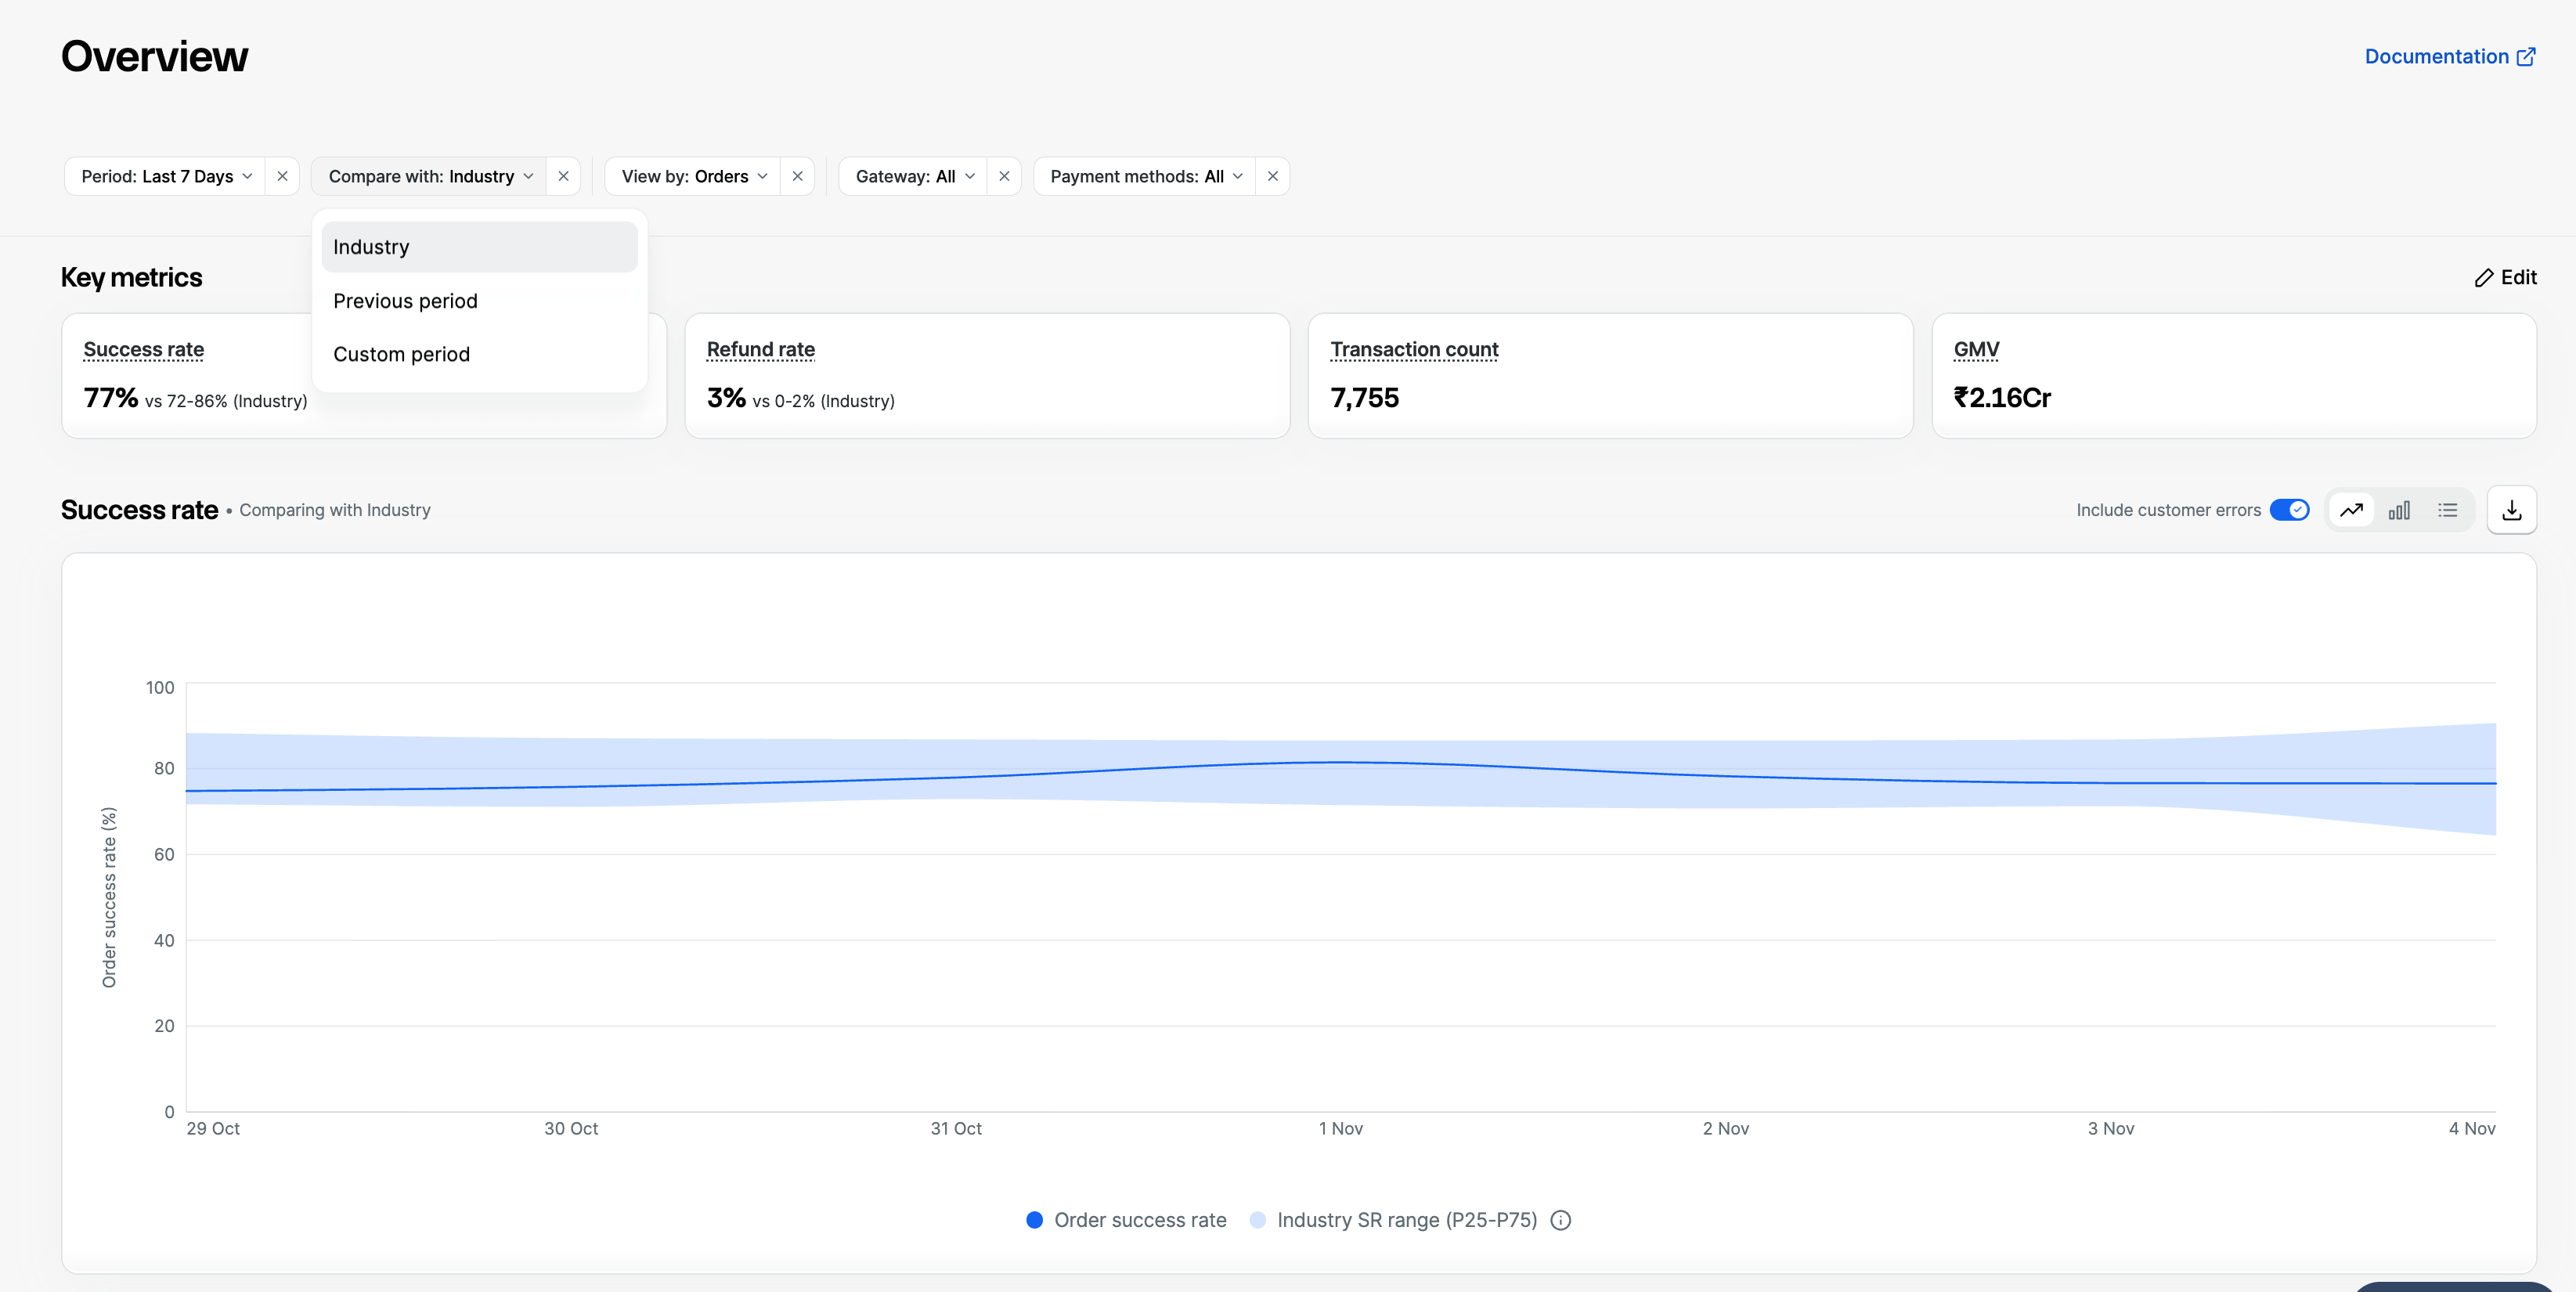
Industry comparison is available on request. To enable it for your account, reach out to your Razorpay Account Manager or Razorpay Tech Support.
Compare with Your Industry
Once Industry comparison is enabled for your account, Industry is selected by default under Compare with when you open the Overview page. With Industry selected, you see an Industry range next to your own numbers in three places:- Key metrics: your Success rate, Failure rate and Refund rate, each with the Industry range beside it.
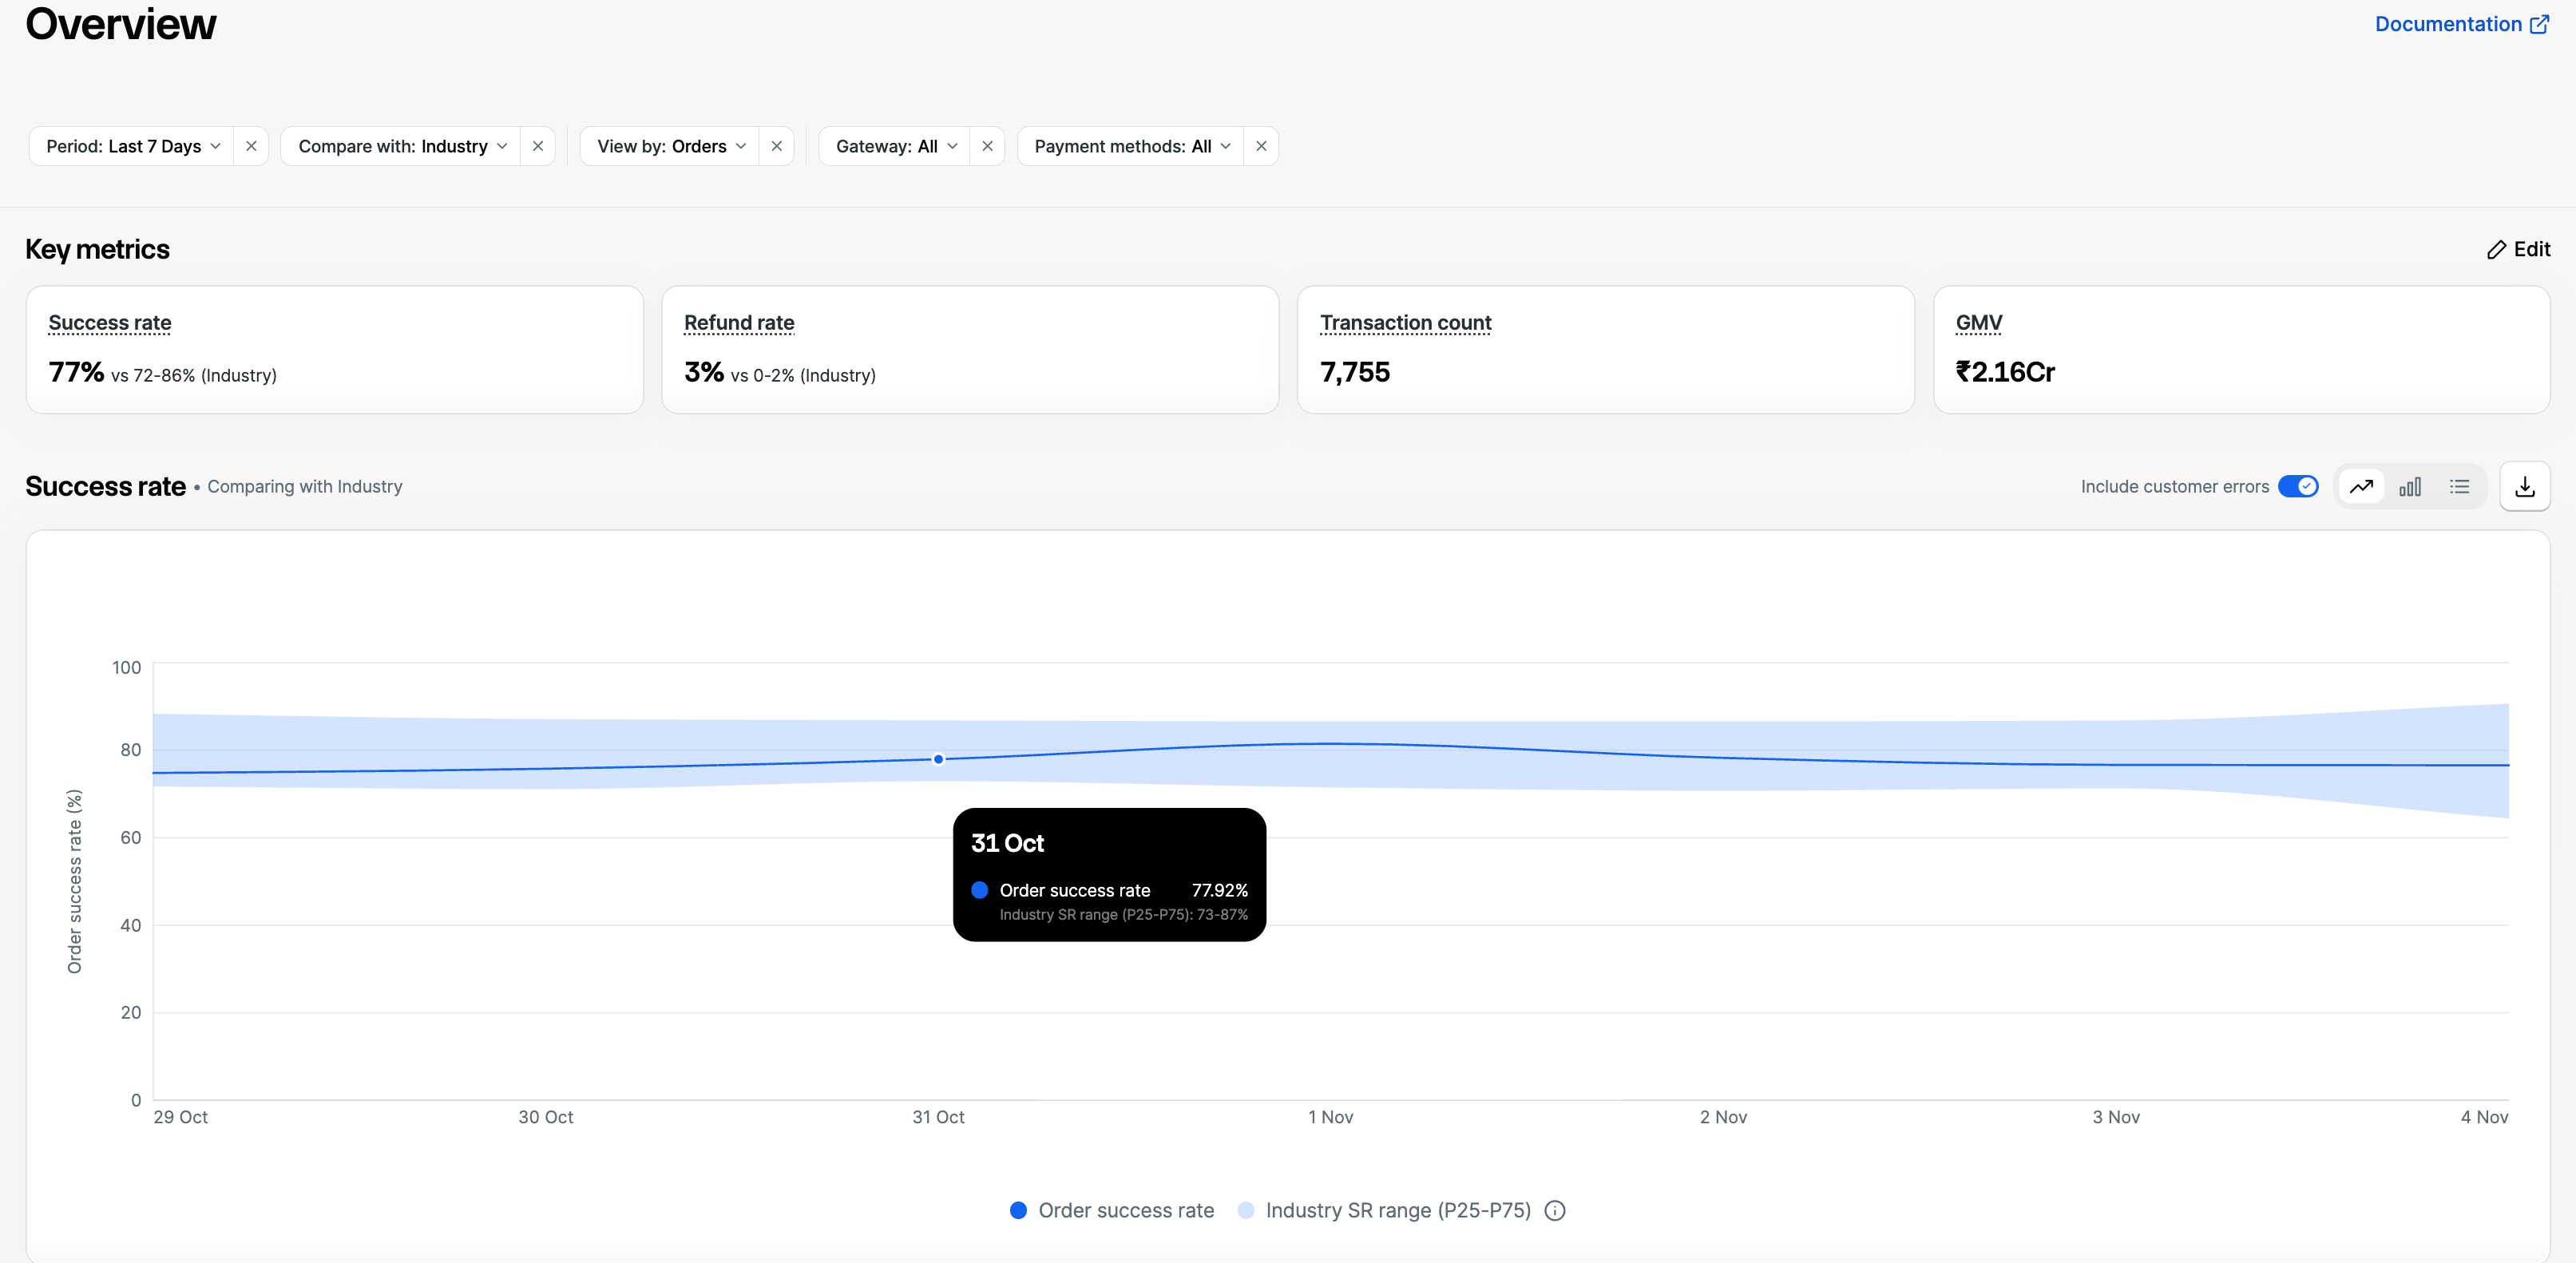
- Success rate trend: a shaded band behind your trend line.
- Transaction failures: an Industry range column on the source summary and on Top failure reasons.
Understand the Industry Range
The Industry range shows the 25th to 75th percentile of businesses like yours. In tight spaces it is written as P25-P75. Use the range to read your own number:- Inside the range: your number is normal for your industry.
- Success rate below the range, or failure rate or refund rate above it: worth a closer look.
- Success rate above the range, or failure rate or refund rate below it: you are doing better than most businesses like yours.
View the Industry Range on Key Metrics
The Key metrics section shows your Success rate, Failure rate and Refund rate along with the Industry range, for example 77% vs 65-81% (Industry).- Select one payment method to see the range for that method.
- Select more than one payment method to see a range blended across the methods you selected.
- Leave Payment methods on All to see an overall range.
The comparison is worked out for each payment method. For the most precise read, select one payment method and a longer period such as the last 30 days.
Track Your Success Rate Against the Industry
The Success rate chart shows a shaded band labelled Industry SR range (P25-P75) behind your own trend line. Use it to see whether your success rate stayed inside the typical range over the period you selected.- If you select more than one payment method, the chart shows one band for each method.
- Use the date range and the grouping options above the chart to see the trend over a different period.
Understand Failures with the Industry Range
The Transaction failures section already shows why payments failed. The Industry range column shows whether a failure source or reason is unusual for your industry.- On the Source summary, each source (Customer, Business, Gateway, Razorpay and Others) shows the Industry range for its share of failures.
- On Top failure reasons, each combination of reason, source and step shows its own Industry range.
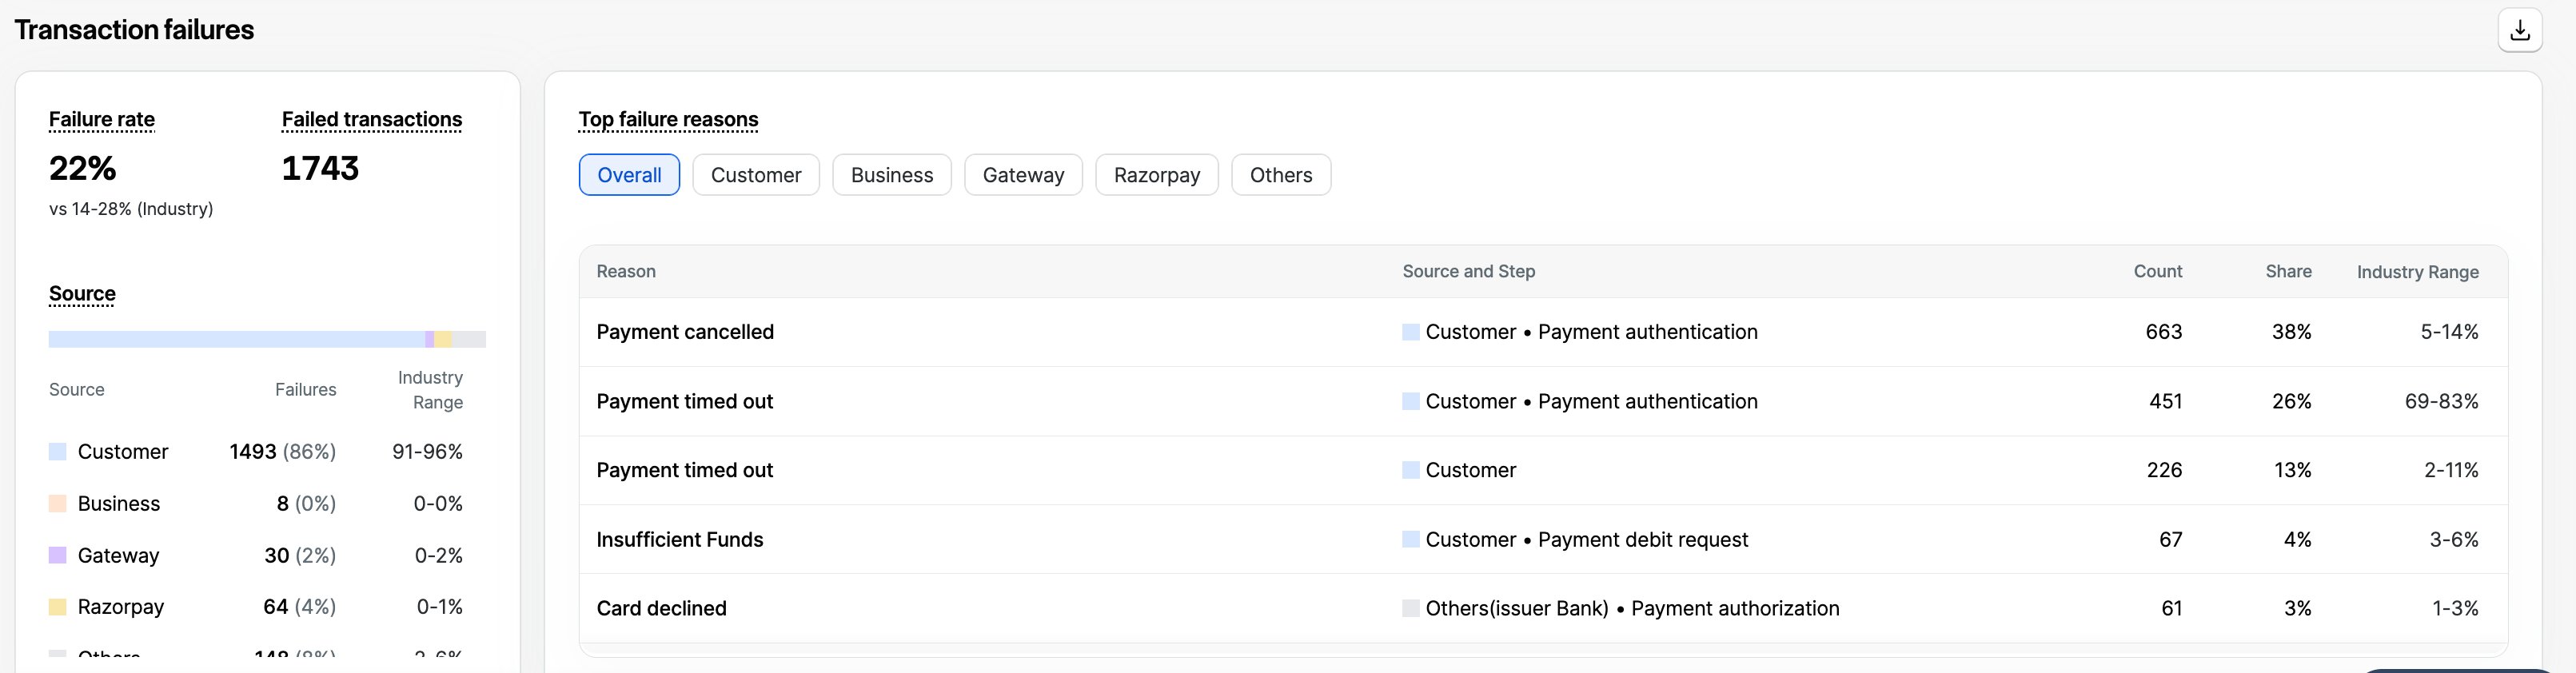
Hover over the Industry range column heading to see 25th-75th percentile among your Industry peers.
How Your Industry Peers Are Chosen
Your peers are other businesses with:- The same merchant category (MCC).
- The same subcategory.
- A similar average order value, within 20% of yours.
When Industry Comparison Does Not Show
If Industry does not appear under Compare with at all, Industry comparison is not enabled for your account. Reach out to your Razorpay Account Manager or Razorpay Tech Support.