

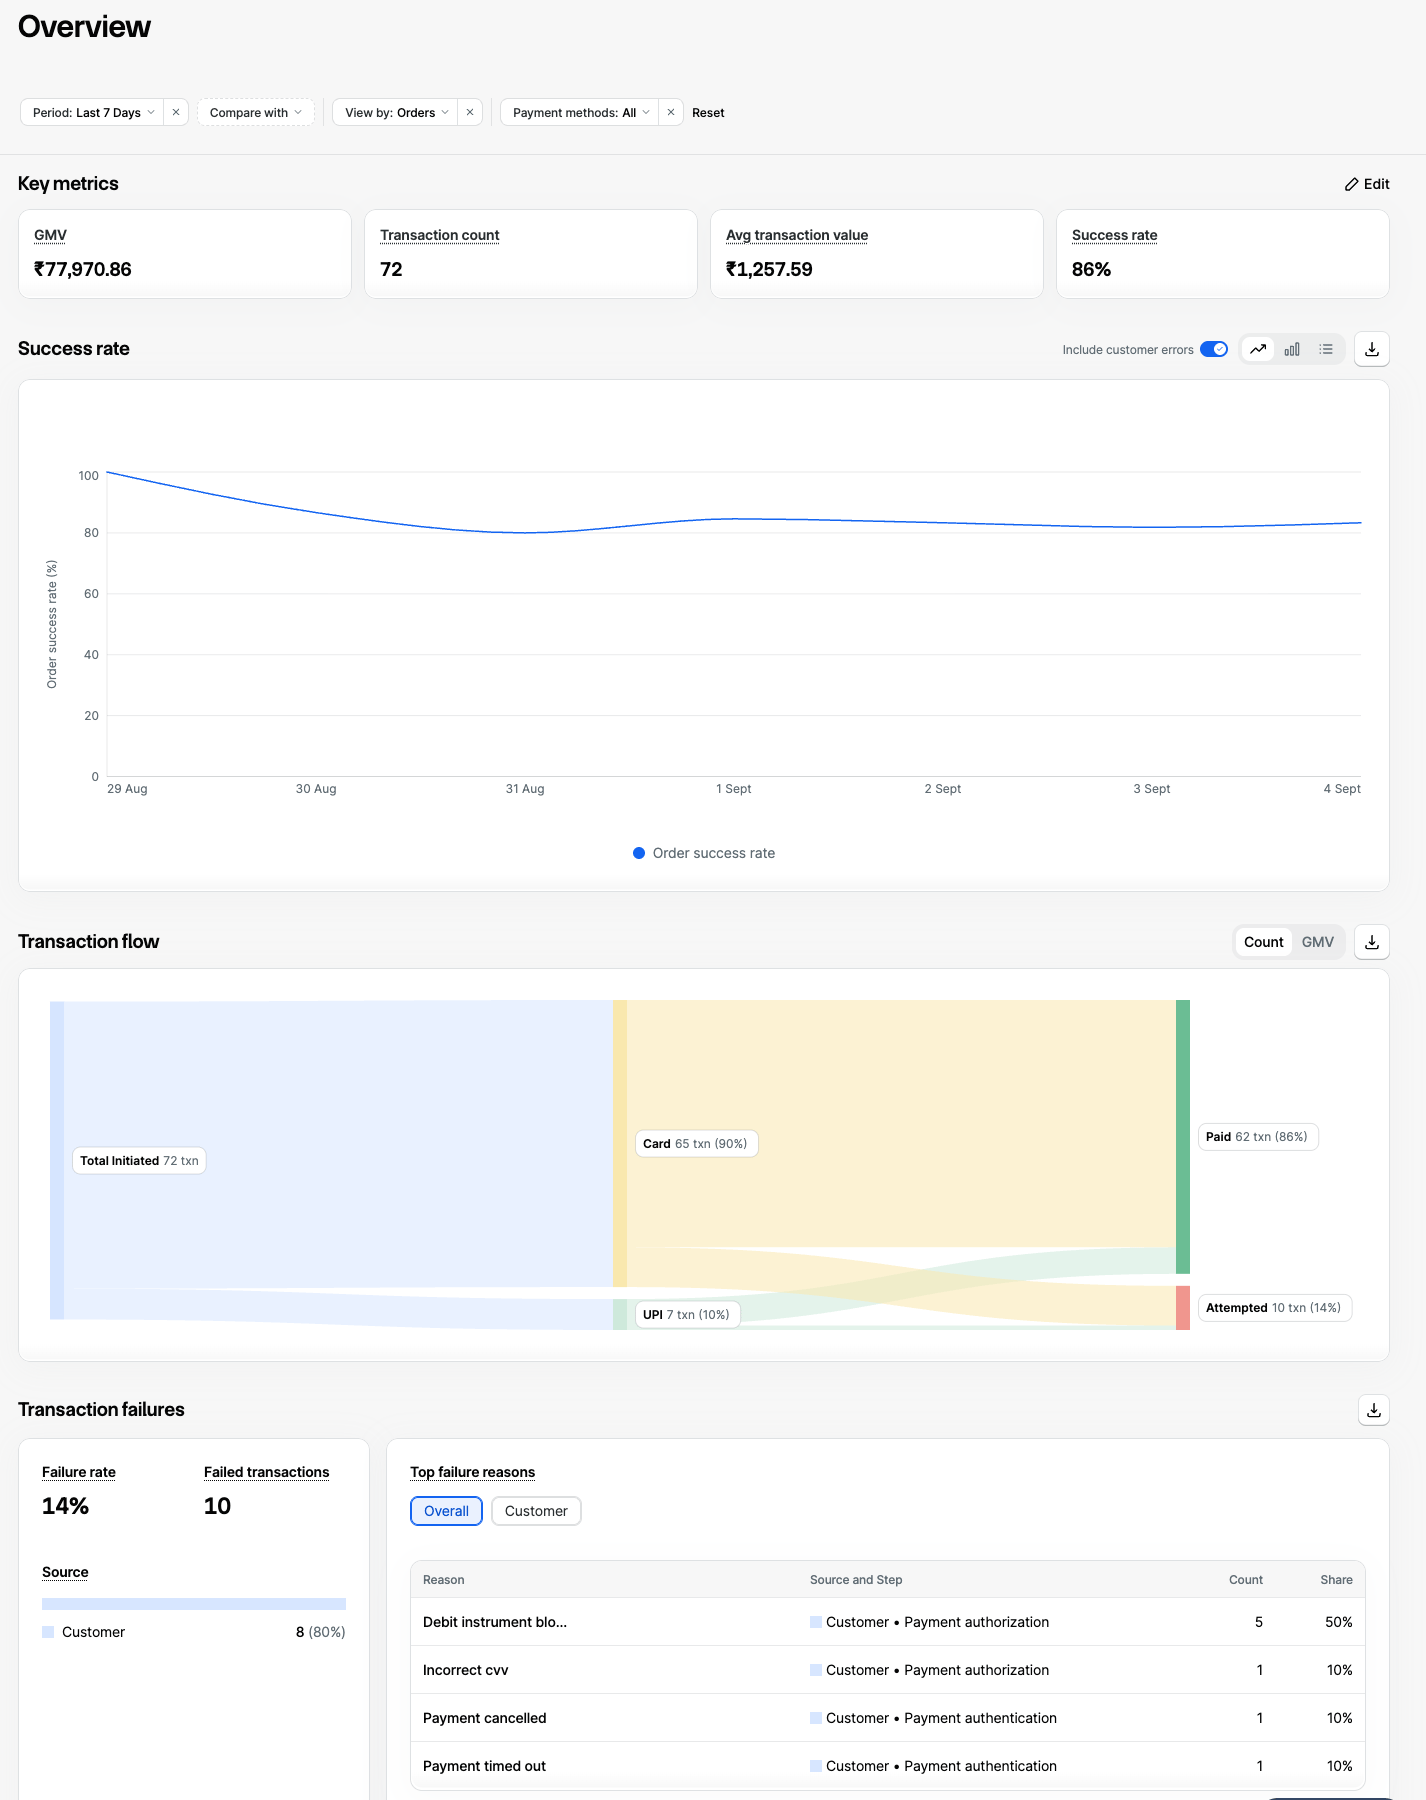
Apply Global Filters

Please note data will be available since the time Analytics has been enabled on your account.
- Select the Date Range.
- Click Compare with to compare the selected range against another date range.
- Set View by to Orders or Payments.
- For Optimizer Merchants (routing to external PA/PGs): Filter by Gateway (specific gateway, No Gateway, or All).
- Filter by Payment methods (specific method or All).
- Click Clear Filter to clear all selections and return to default.
No Gateway refers to transactions where the customer abandoned checkout before a gateway was selected for routing. These are not attributed to any gateway.
Pin Key Metrics
You can pin upto 4 of your most-tracked metrics as KPI chips to the top of the Dashboard. By defualt, GMV, Transaction count, Average Transaction Value, and Success Rate are pinned. Please note, each KPI value reflects your Global Filter selection.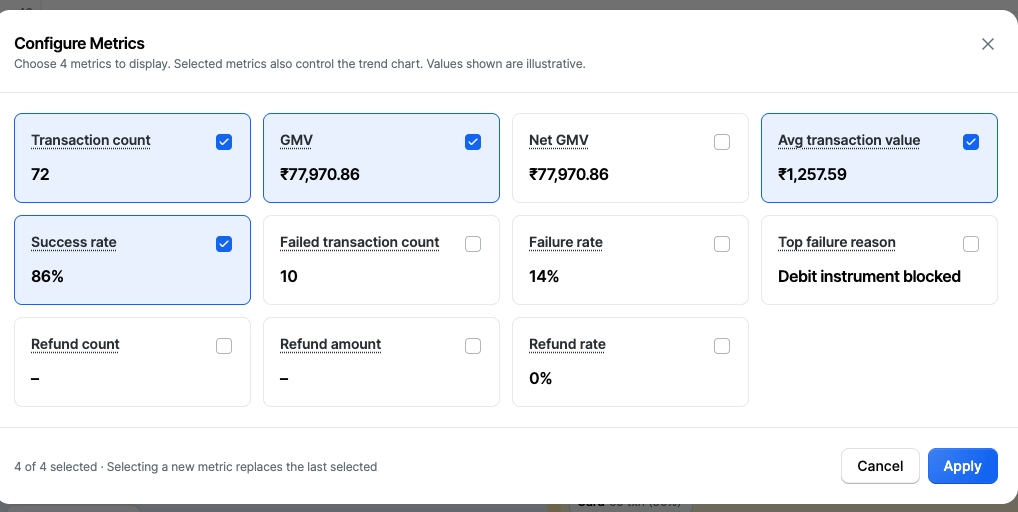
Each Metric is defined based on your View By selection in the Global Filter.
- Click Edit to choose from the full metric list. Please refer the table below for complete Metric definitions:
Track Success Rate Trends
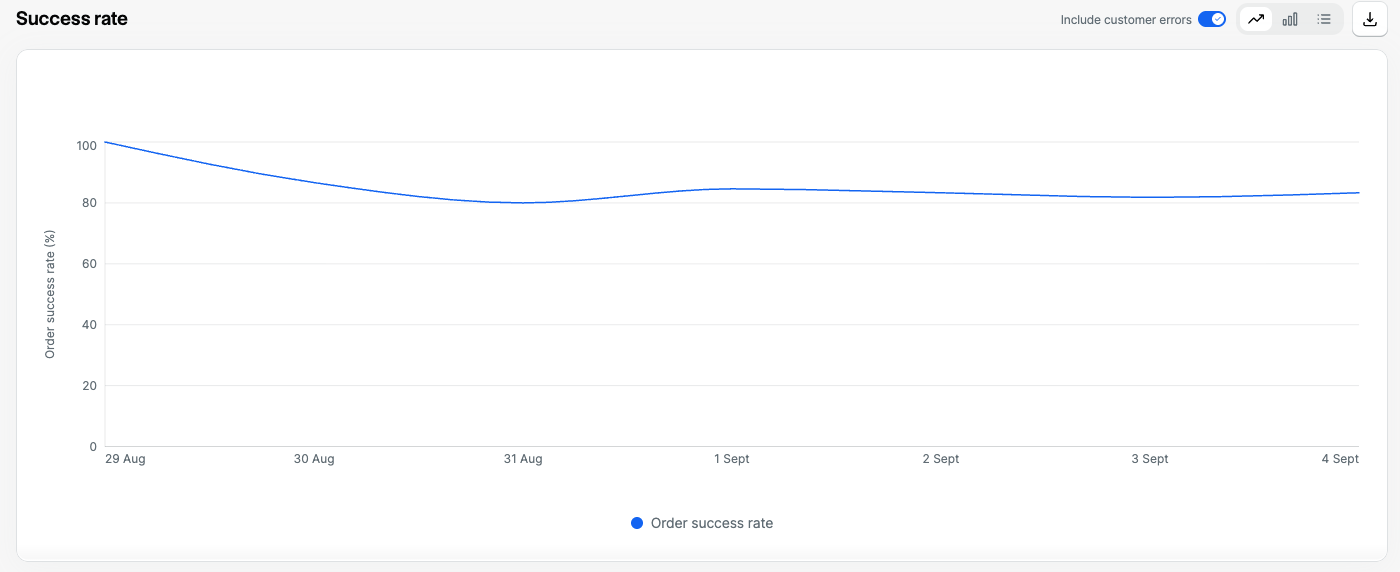
- Group by Hourly, Daily, Weekly or Monthly (default: Daily).
- Use Compare with (Global Filters) to compare against another date range.
- Toggle Include customer errors to view actionable success rate excluding customer-side errors (chart-level filter only).
- Switch views: Trend line, Bar chart, Data table.
- Download as CSV.
Customer-side errors are payment failures caused by the customer rather than your integration or the gateway, such as the customer abandoning the payment, entering an incorrect OTP or having insufficient funds. These are usually outside your control, so excluding them shows your actionable success rate. To learn more about customer errors, see the full list of Payment Errors .
Analyse Transaction Flow
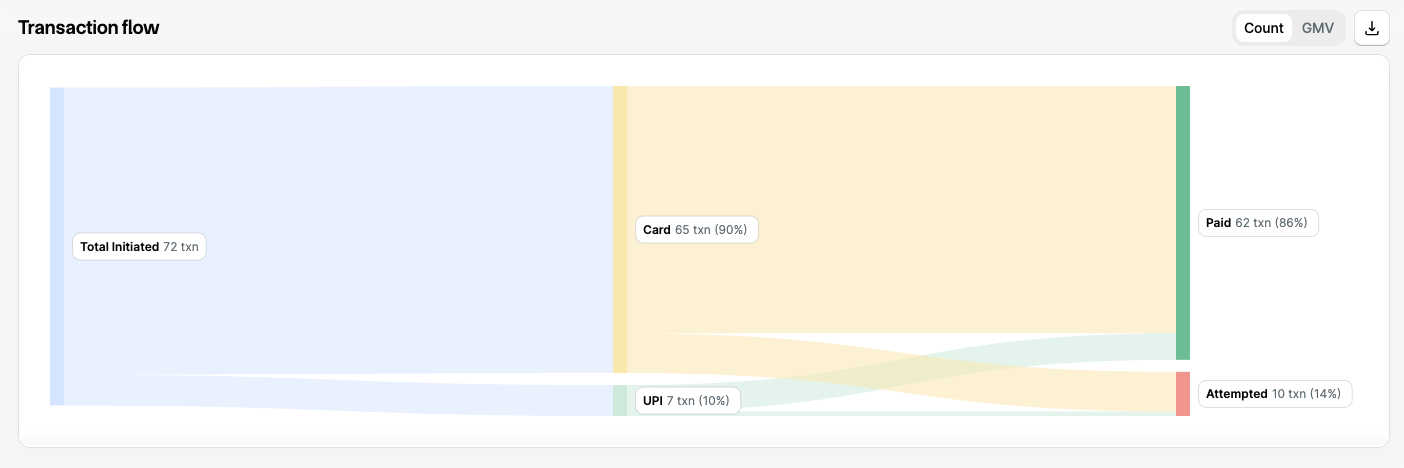
- Toggle between Count and GMV for a different view of transaction flow
- Final transaction status updates by View by:
- Payments: Authorised, Failed, Refunded, Captured
- Orders: Attempted, Paid
- Download via the top-right option.
The gateway stage is shown only for merchants using Optimizer . It is not applicable for payments processed directly through Razorpay.
Transaction Failures Deep Dive
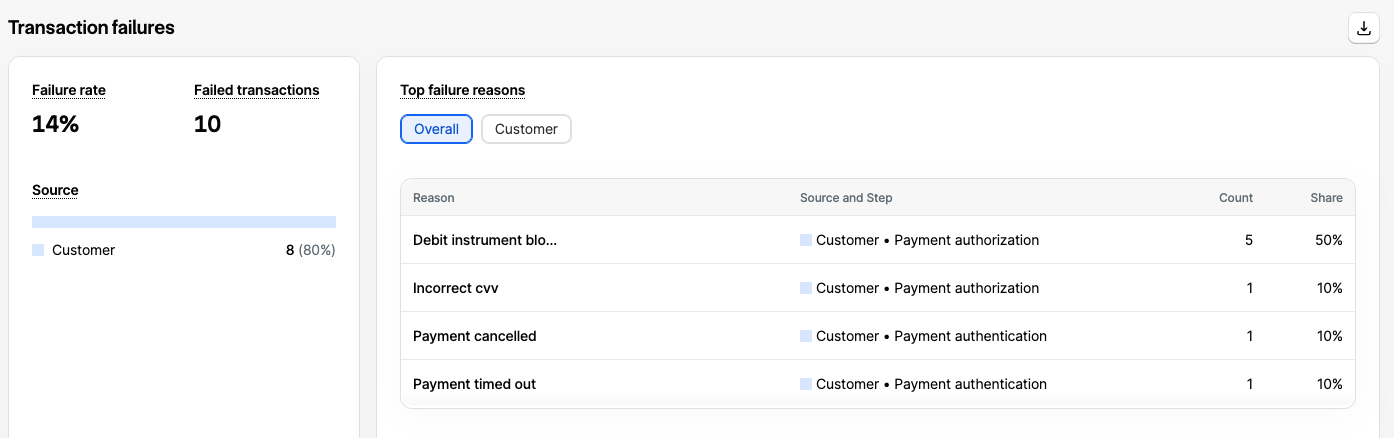
- View overall Failure rate and Failed transactions count for selected filters.
- Quick summary of failure sources click a source to filter the table below, double-click to remove.
- Table of Source, Step, Reason for deep-dives
- View each combination’s share (%) of overall failures.
- Compare with adds a trend column showing lift vs. selected time range, plus delta on top metrics.
- Download the data.
Failure rate calculation by View by:
- Orders: (orders where all linked attempts failed) ÷ (all orders attempted)
- Payments: failed payments ÷ all payments created