Set Up Custom Views
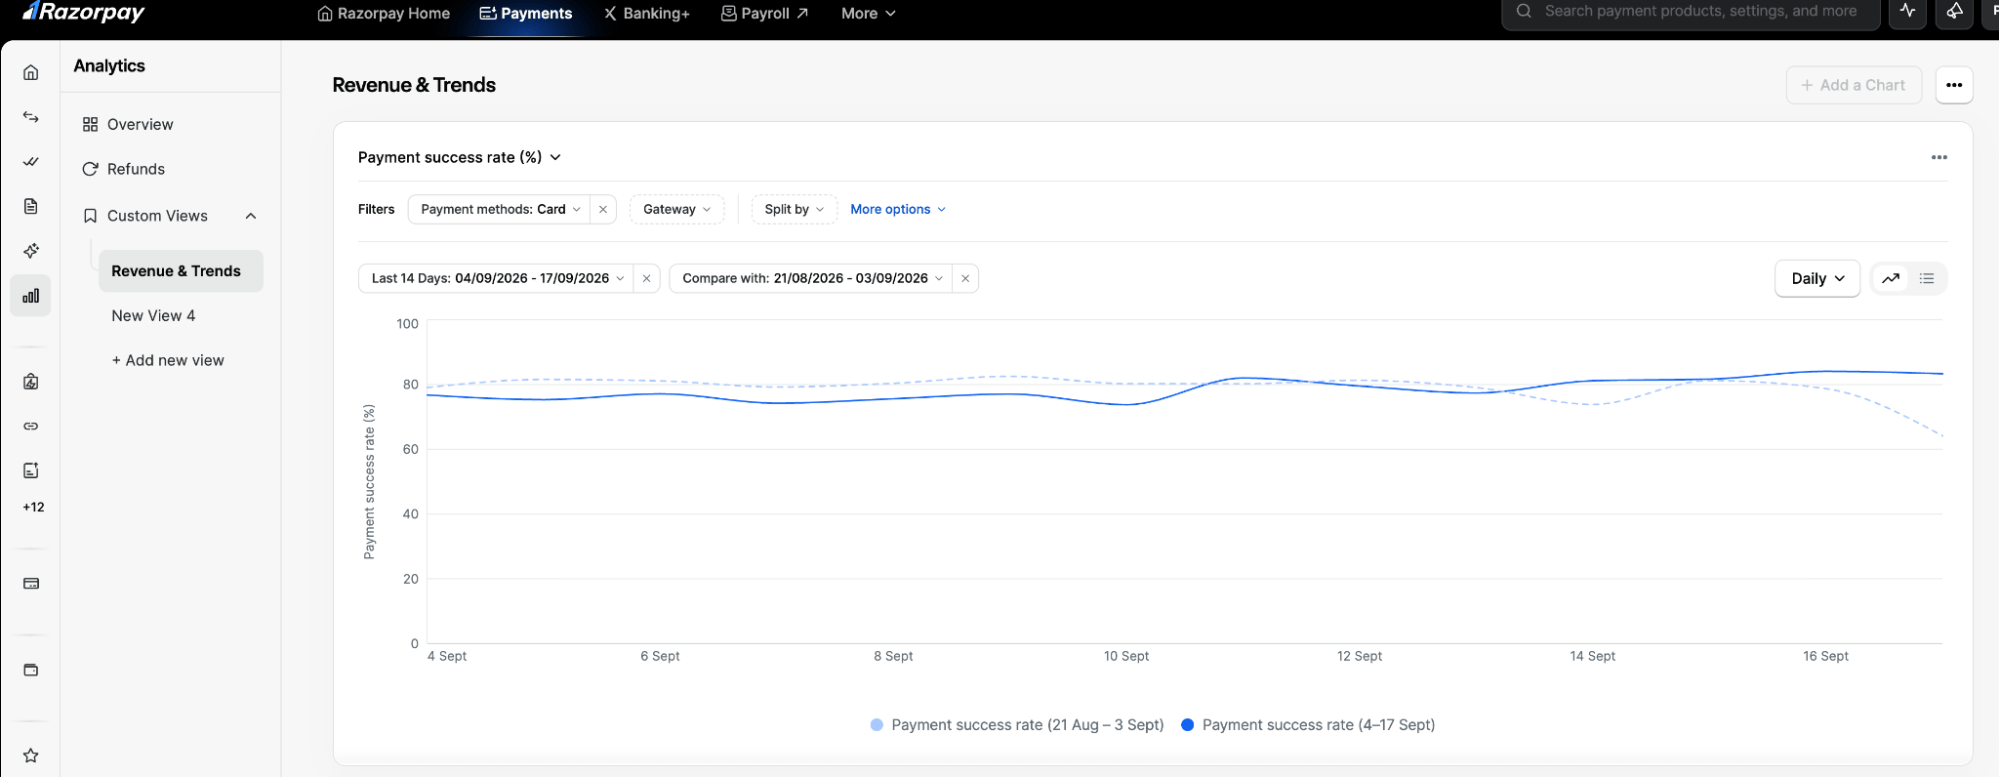
Open Custom Views
In the Dashboard menu, go to Analytics. Custom Views sits next to Overview and Refunds in Analytics. Every saved view appears in the menu under Custom Views. Click a view to open it, or click + Add new view to start a blank one.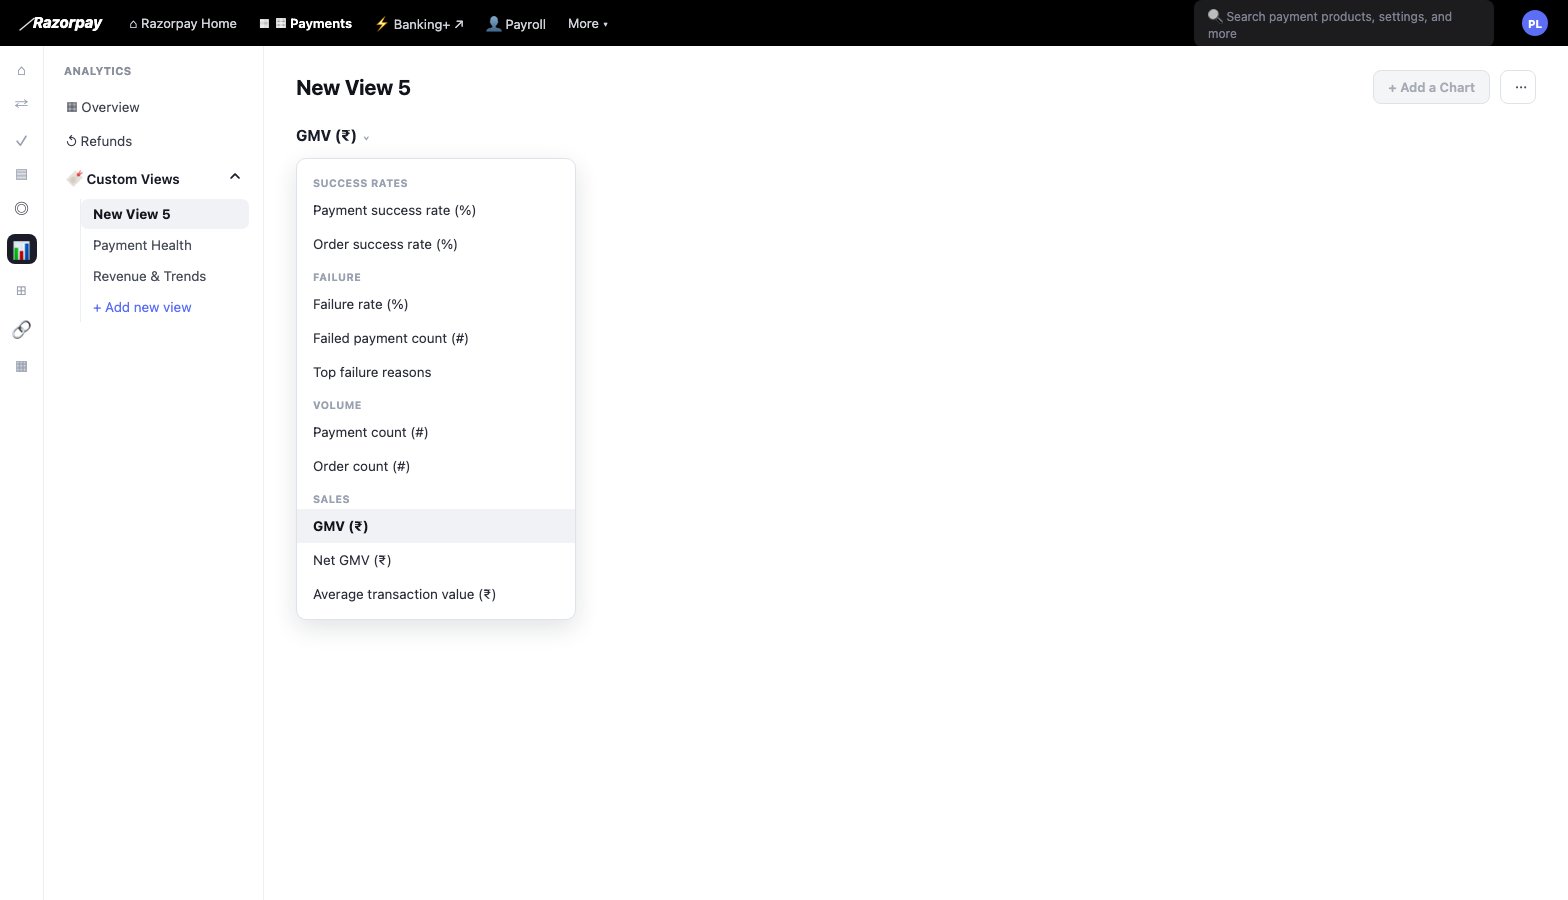
Build a Chart
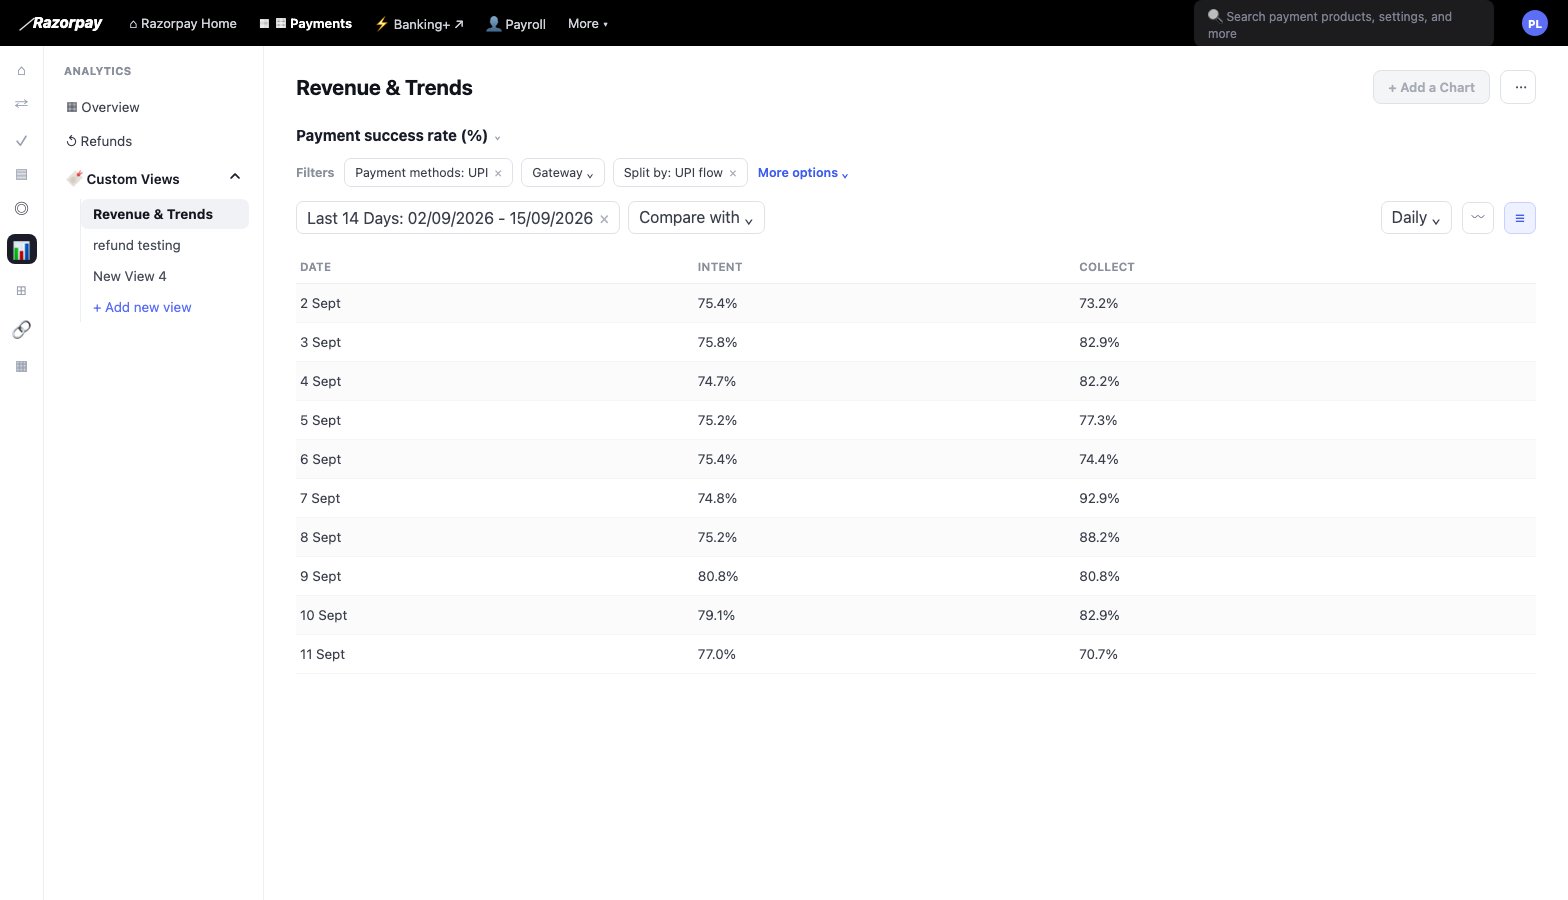
Follow the steps below to build a chart:- Choose a metric: Click the metric name at the top of a chart to pick a metric. Metrics are grouped into 5 categories: Success Rates, Volume, Sales, Failures and Refunds.
- Add filters: Up to 3. Values within one filter combine with OR. Different filters combine with AND. Click More Options → Show all to see every dimension.
- Choose how to split: Split the chart with up to 2 parameters. Each combination becomes its own line, bar or table column.
- Pick a time range: Up to 90 days, grouped by hour, day, week or month.
-
Compare with an earlier period: Choose Previous period or a custom date range.
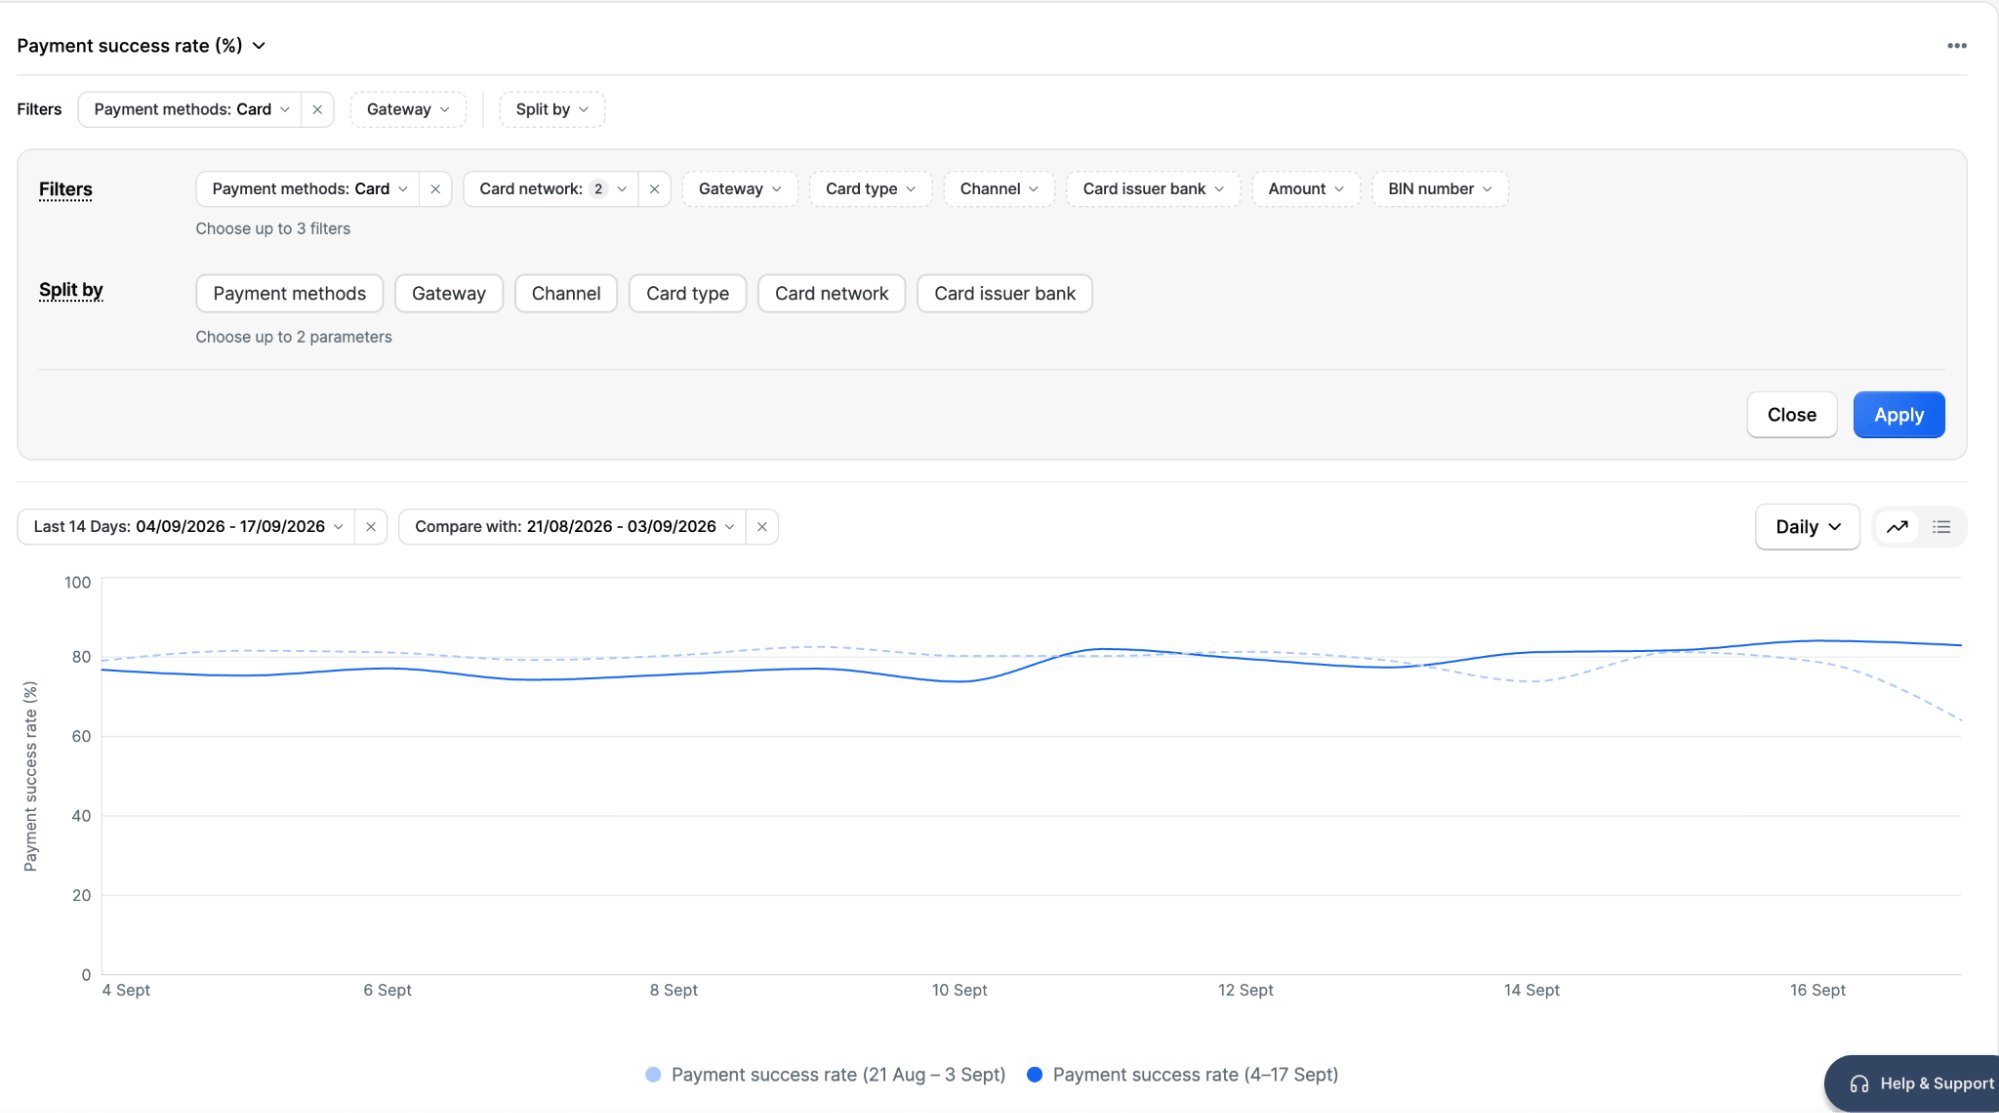
The panel adjusts its suggestions based on what you have already picked. For example, choosing UPI under Payment Methods narrows your split options to UPI-only dimensions like Channel and UPI Flow. Card-only dimensions are removed, so you do not end up with an empty or misleading chart.
Metrics Supported
The table below lists the metrics you can plot, grouped by category:Order-level metrics take their attributes from the order’s latest payment attempt. If a customer tries UPI twice and then pays by card, that order counts as a card payment.
Filters and Splits
The table below lists the dimensions available as filters and splits:Download, Duplicate and Export
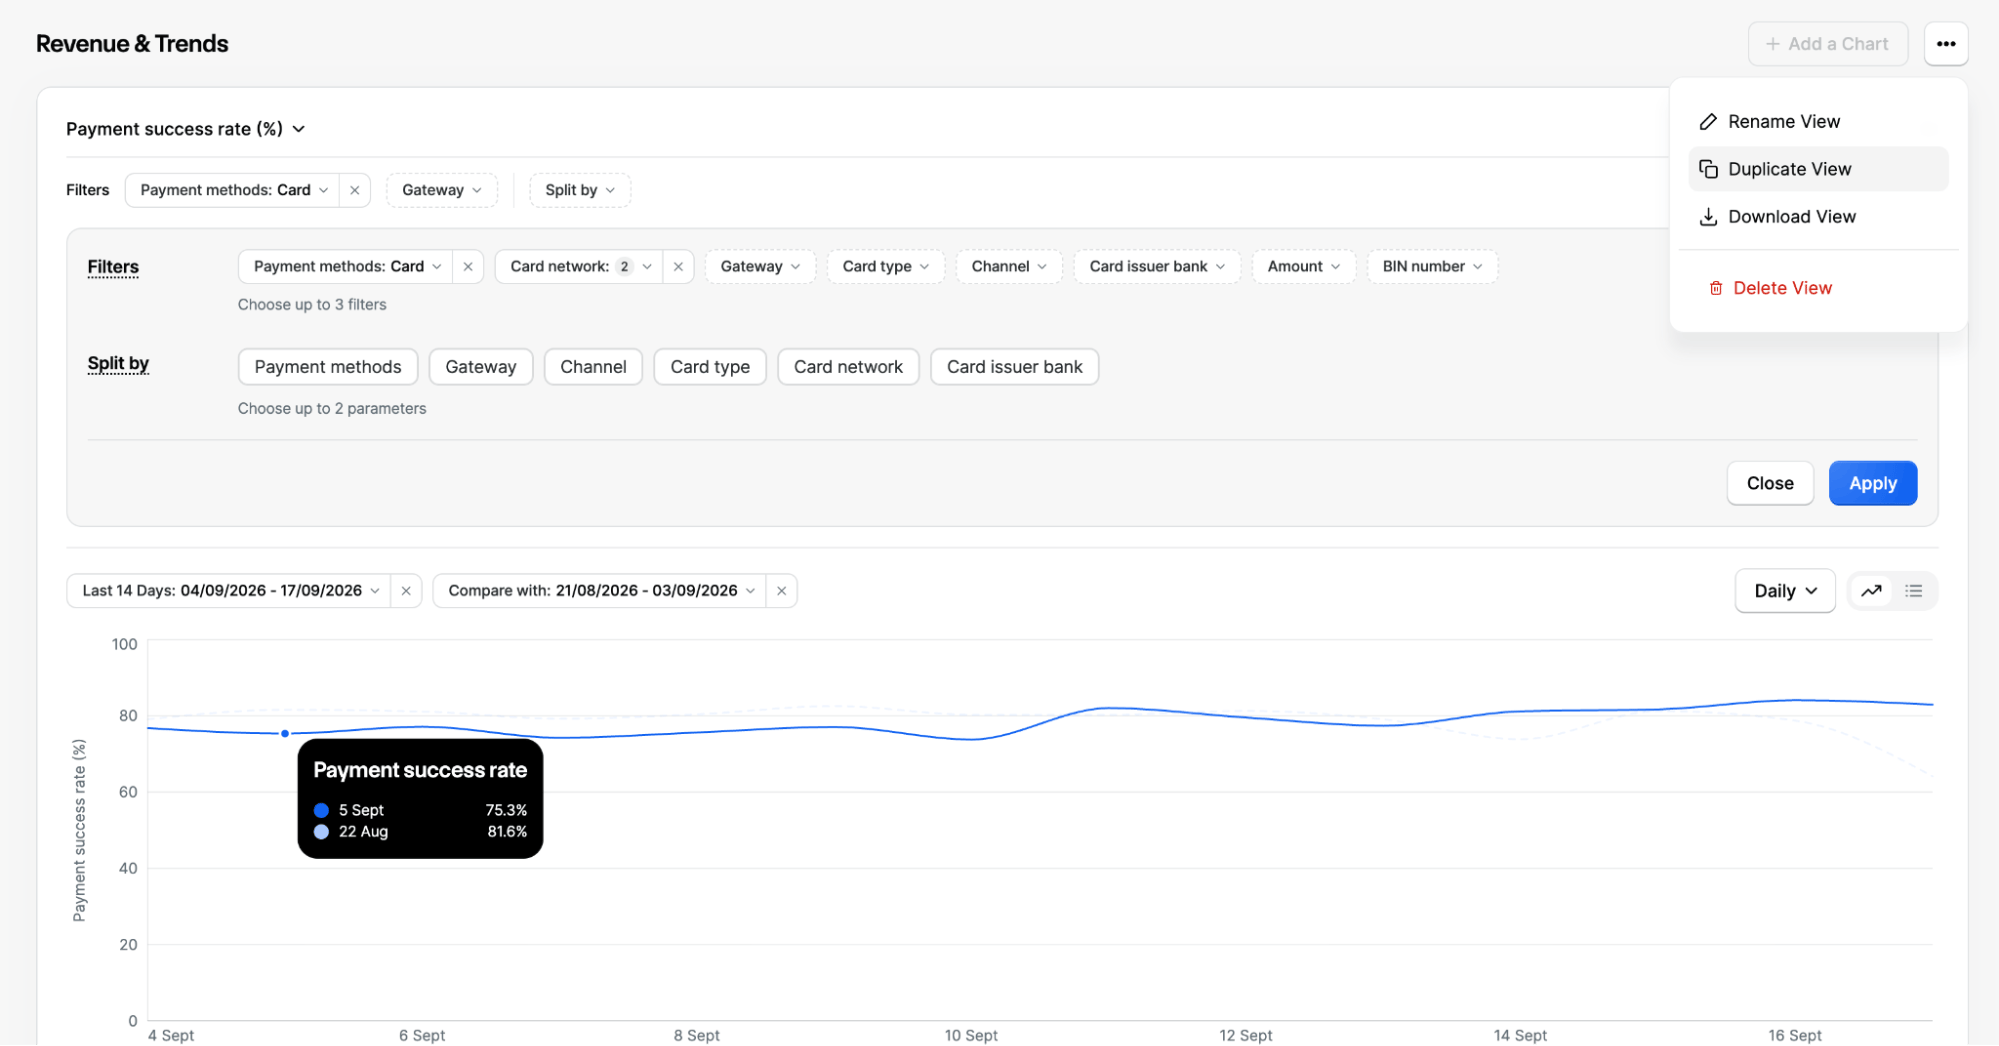
Every change you make to a view saves automatically and stays saved across sessions. For example, a date range like last 14 days is stored as a rolling preset, so the view always shows the latest data when you open it.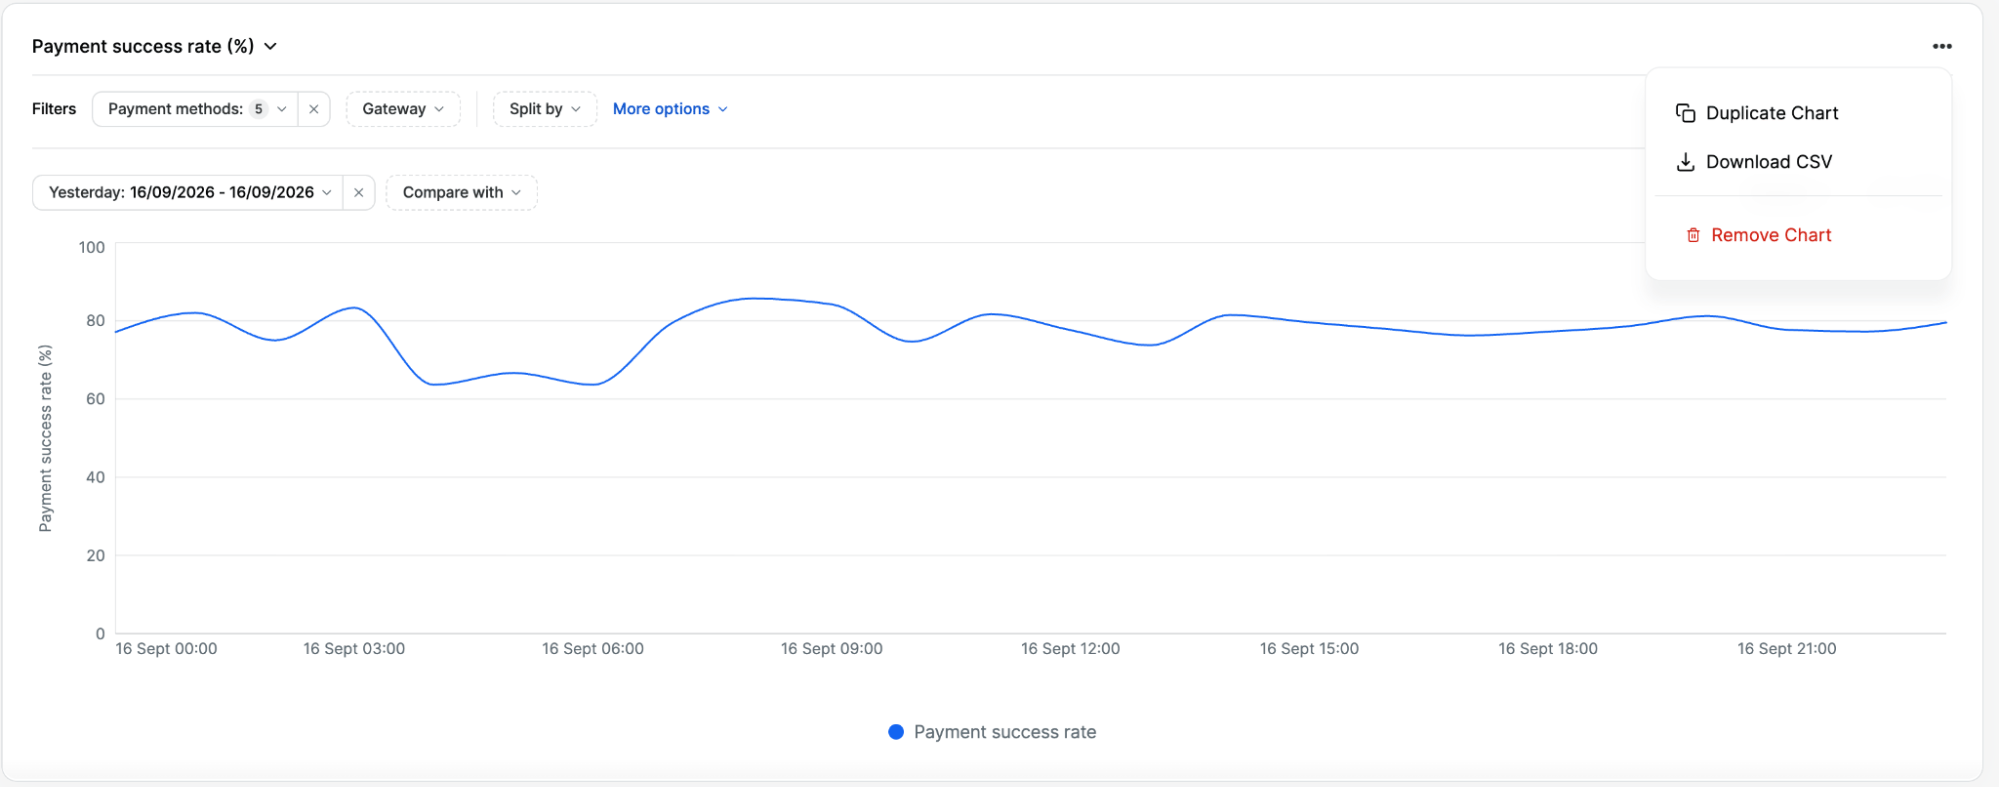
- Rename view
- Duplicate view
- Download view
- Delete view