Table of Contents
What is Debt to Equity Ratio?
Debt to equity ratio is a measure of a company’s financial standing. It indicates whether a business is financing operations with debt or with its own resources.
A higher debt to equity ratio indicates that the business’s operations are largely financed by debt, which could prove to be risky if not handled well. A lower debt to equity ratio indicates that the business’s operations are largely financed by equity and shareholder funding.
It’s important to measure and track the D/E ratio of a business because it helps stakeholders understand at what point the business has taken on more debt than it can handle.
Debt to Equity Ratio Formula
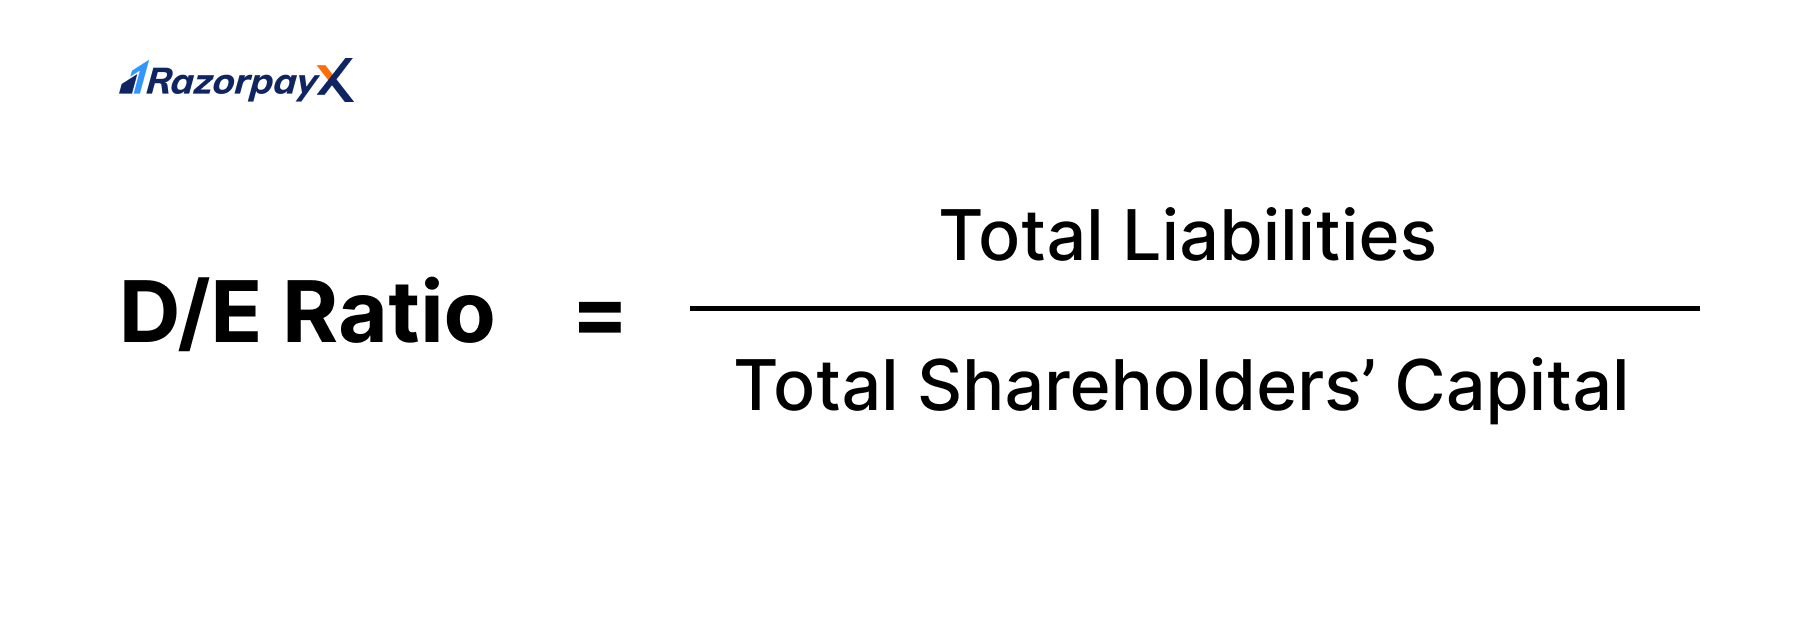
The formula to calculate debt to equity ratio is:
 Debt, or the total liabilities includes both current and non-current liabilities, while equity, or shareholders’ equity includes all the money earned by issuing shares. How would we calculate the D/E ratio using these values?
How to Calculate Debt to Equity Ratio?
All the information needed to calculate this ratio is found on your business’s balance sheet. The total liabilities of the business include:
- Current liabilities – Liabilities that will mature within one accounting cycle, like accounts payable and short-term debt
- Non-current liabilities – Long term liabilities that will take multiple accounting cycles to mature, like long-term debt
Shareholder’s equity includes all money earned by issuing shares to the shareholders. This includes shares issued like common stock, preferred stock.
It is important to note that retained earnings are not included in this calculation, despite its inclusion in shareholders’ equity in the Balance Sheet.
The values needed to calculate the debt to equity ratio can be derived from the accounting formula as well.
Assets = Liabilities + Shareholder’s Equity
Debt to Equity Ratio Meaning
The D/E ratio tells us how much debt the business has taken on against its own resources.
For example, if a company has debt to equity ratio of 1.5, it means that it has Rs 1.50 in debt for every Rs 1 of equity.
Debt to equity ratio tells us where the business stands in terms of being able to repay this debt and continue operations. If it is very high, the business has high dependence on debt for daily operations – and may not be able to repay this debt if times get hard.
In short, the higher the debt to equity ratio, the riskier the business.
Investors, banks and other lending institutions look at the debt to equity ratio before deciding to lend or invest in a business. Let’s see how they interpret the debt to equity ratio, and what a good debt to equity ratio looks like.
Importance of Debt to Equity Ratio
Investors, banks and other financial institutions use this ratio (amongst other ratios and analysis) to calculate the risk of investing or lending to a business. The ideal debt to equity ratio varies from industry to industry.
Here’s a table with the industry wise differences in D/E ratio as interpreted by investors and lenders.
| Criteria | High D/E | Low D/E |
| Cash Flow | Industries with stable cash flows and low business risk, such as utilities or consumer staples, might tolerate higher debt levels. | Industries with volatile revenues and higher business risk, like technology startups or cyclical manufacturing, may opt for lower debt to mitigate potential financial distress. |
| Growth opportunities | Biotechnology firms with promising drug candidates and significant research and development needs may tolerate a higher D/E ratio. | Mature industries with limited growth prospects and fewer expansion opportunities will have a much lower D/E ratio. |
| Asset Intensity | Industries that require significant capital investment in physical assets (e.g., manufacturing or energy) might use more debt to finance these assets. | Service industries (e.g., consulting or software development) may have lower capital requirements and therefore opt for lower debt levels. |
| Regulatory restrictions | Pharma businesses with strong patent protection and stable revenue streams have a higher debt tolerance due to their increased ability to repay debt. | Banks are subject to strict regulatory capital requirements that limit their debt capacity have a much lesser debt tolerance. |
Industry-wise Debt to Equity Ratio
As discussed above, the ideal range for debt to equity ratio is highly volatile across industries.
A “good” debt to equity ratio depends on various factors, including the company’s risk tolerance, growth plans, and prevailing economic conditions.
A good rule of thumb to follow would be to ensure your debt to equity ratio is below 2 – anything above 2 is considered very unstable and risky.
| Industry | Typical Debt to Equity Ratio Range |
| Utilities | 0.3 – 1.0 |
| Consumer Staples | 0.2 – 0.7 |
| Healthcare | 0.3 – 0.8 |
| Technology (Software) | 0.2 – 0.6 |
| Financial Services (Banks) | 4.0 – 8.0 |
| Telecommunications | 1.0 – 2.5 |
| Industrial Manufacturing | 0.4 – 1.0 |
| Consumer Discretionary (Retail) | 0.5 – 1.5 |
| Energy (Oil & Gas) | 0.4 – 1.5 |
| Real Estate | 0.7 – 1.5 |
| Transportation (Airlines) | 0.5 – 2.0 |
| Materials (Mining) | 0.4 – 1.2 |
| Pharmaceuticals | 0.3 – 0.7 |
| Biotechnology | 0.2 – 0.6 |
| Construction | 0.5 – 1.5 |
| Technology (Hardware) | 0.3 – 0.8 |
| Agriculture | 0.2 – 0.6 |
| Tourism and Hospitality | 0.5 – 1.2 |
Note* The values provided here are approximate and should be used as a general guideline
Improving D/E Ratio
How do you make sure your business’s D/E ratio is in the ideal range? Here’s a quick checklist for you:
- Ensure manageable debt levels: a business with an annual turnover of Rs 10 crores can afford a loan of Rs Rs 10 lakhs, but for a business with an annual turnover of Rs 1 lakh, the same loan would be extremely difficult to manage.
- Pay off loans: the quicker you are able to repay your loans, the better your debt to equity ratio will look. The more debt you hold, the higher the D/E ratio gets. One good way to do this would be to improve your topline numbers and cut expenses.
- Debt restructuring: this is a technique to reduce the interest rates of your existing loans, by either signing a new agreement with your lender agreeing to extending the date or reduce the interest rate.
- Better financial management: automated bookkeeping, tax payments, tech-enabled vendor payments, payroll – these are a few of the ways businesses today ensure that their money is managed correctly.
Example of Debt to Equity Ratio: Adani Enterprises
Let’s understand the debt to equity ratio better using an example: the Balance Sheet of Adani Enterprises. Here’s a snapshot of Adani Enterprises’ Balance sheet for the quarter ended March 2023.
The total shareholders’ funds as per the balance sheet is Rs 13,933.78 and the total liabilities are Rs 17,085.10.
If we put these values into the formula, we find that the debt to equity ratio is:
17,085.10/13,933.78 = 1.22
Therefore, the debt to equity ratio for Adani Enterprises for the quarter ended March 2023 is 1.22.
FAQs
What is a good debt to equity ratio?
The ideal range varies across industries. A basic rule of thumb would be to ensure that your debt to equity ratio stays below 2.
What does debt to equity ratio measure?
The debt to equity ratio measures how much debt the company has against its own financial resources. For every rupee of debt, how much capital does your business have? The D/E ratio answers this question.
What is a bad debt to equity ratio?
Anything above 2 should raise alarm bells. This means that more than two-thirds of the money used in operations comes from debt.


