
UPI has seen a fast ascension, particularly over the last year. There are streams of banks, wallets and digital payment companies like Google Pay, PhonePe, Paytm, etc, that are pushing UPI as one of the preferred payment options.
As of today, we use UPI for mostly everything. From purchasing staple goods to paying rent, taxi rides to booking flight tickets, UPI has become a way of life. Read more on this in our The Era of Rising Fintech report.
According to NPCI, UPI based digital payments for July touched 822.2 million, which is enough to make UPI as the reigning champion of the payments throne.
UPI is generally used for two kinds of transactions:
- Person to Person (P2P)
- Person to Merchant (P2M)
Once hailed as a P2P payment mode in 2017, UPI, in two years, has matured as a preferred P2M payment platform.
At Razorpay, we observe UPI based P2M transactions from over 350,000+ businesses, which includes IRCTC, BookMyShow, Zomato, Airtel and many more.
Hence, we have analysed the transactions that took place on Razorpay to see who wears the hat among the apps.
Google Pay continues going strong

Guessing is too mainstream because consistency has a new name.
Cutting through the noise to the top is Google Pay–the choice of customers over any other app in the payment landscape. 59.23% is a humongous chunk of total UPI transactions! Well, it seems like changing the name from Tez came to fruition.
Keeping the second spot tight and bright is PhonePe with 24.70% of UPI transactions.
Whereas, the third spot is owned by Paytm with 6.35% UPI transactions made via the app and finally, BHIM takes the fourth place with 5.37% transactions.
Banking UPI apps that didn’t make it to the list are ICICI, SBI, Axis and HDFC with 1.42%, 0.34%, 0.18% and 0.08%.
Let’s turn the page and inquire about the growth of popular UPI apps.

Surprisingly, the popular UPI apps are painted red, whereas, UPI apps of the banks have seen moderate growth. Still unbelievable.
Being used by many, Google Pay saw a staggering 10.5% growth in June. Basking in old glory was short-lived, while July has a 0.9% decline in growth for the app.
PhonePe suffered the same fate with a negative 3.9% growth, but the worst happened to Paytm and BHIM with a negative 26.9% and 17.9%.
And who said banks were old-school? UPI apps by banks are back for their bucks.
ICICI and SBI lock horns with close combat–a 13% growth, and HDFC dethrones Axis with 8 points, which seems fair.
UPI contributions across regions – A tale of many cities
The future of digital payments in India demands innovation and UPI has filled the void quite effectively. The mobile-only payment system is emerging as a primary payment option for Indian users, but do you know about the regions that contribute to a digital economy?
- Karnataka leads the hub, which contributed 26.92% UPI contribution throughout the country, and Bengaluru left its mark with a stunning 37.1%
- Maharashtra proved its mettle by contributing 15.29%, while Pune raked in 9.4% growth
- Finally, Andhra Pradesh and Telangana have seen 11.63% transactions rate, to which Hyderabad responded with a 13 pointer in comparison to others
Here’s a Tier wise split infographic.

Of course, the Tier 1 cities remain undisputed with 64.30% contribution towards the digital economy, but the Tier 2 and 3 cities have caught the wind and have managed to draw 29.91% and 5.78% respectively.
Bengaluru tops the Tier 1 cities list, only to be followed by Hyderabad. Whereas, Pune holds the secondary base uptight.
Contribution across payment modes In July – Preferred and favourite
UPI isn’t the sole player in the payment landscape. There are other modes like credit and debit cards, netbanking, bank transfers, etc.
Let’s scrutinise their share.
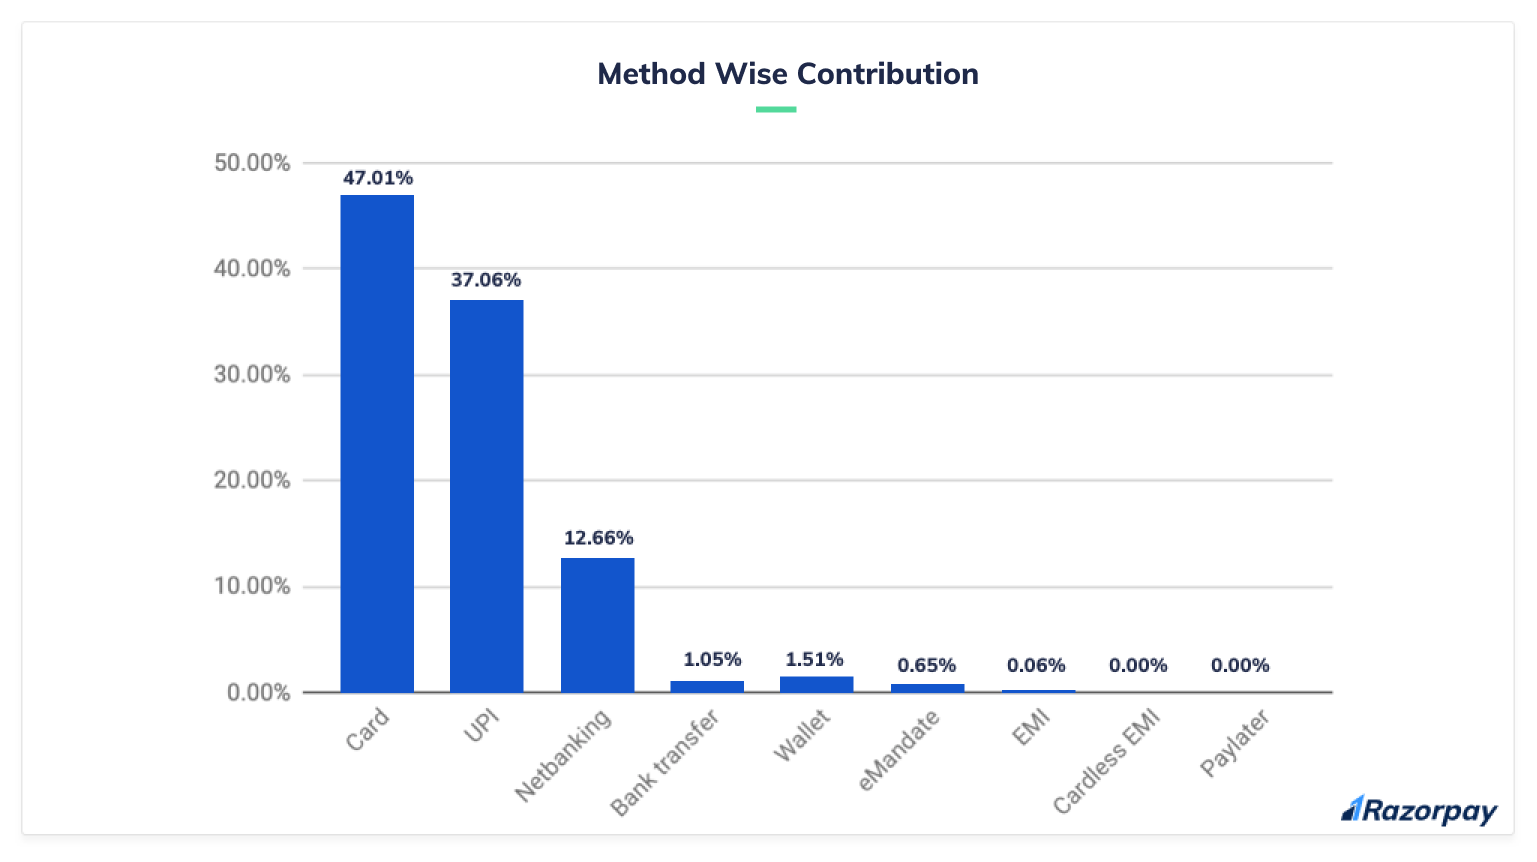
- If UPI is the most preferred payment mode, then plastic money is the favourite. Indian customers love to swipe, which gives us a number–47.01% transactions are from credit and debit cards
- Still the second favourite, UPI retained its position with 37.06%, which is a slight increase from June
- Netbanking saw a nominal dip and remained in the third spot with a 12.66%.
- Bank transfer, wallets, e-mandate, and EMI saw similar figures like 1.05%, 1.51%, 0.65% and 0.06 compared to June
Average ticket value – Reality blues
The ultimate de-facto for making large value transactions isn’t UPI. According to our insights, customers are still hesitant from making large value UPI transactions.
Let’s dig deeper.
Key takeaways
- Indian customers have shown their trust to EMI in terms of large value transactions
- Cardless EMI, although new to the game has its heart wrapped around customers as the second favoured
- Although old-school, bank transfer, netbanking, e-mandate and card follow the trail as the gatekeepers of their fort
- It seems like UPI and wallets need to up their game to lure customers in favour of large transactions
The show must go on
Cards remain the king of the ring in digital transactions with an overwhelming share of 47.01%, but the UPI share in digital transactions has increased by 1.3% in July as compared to June.
Well, as far as convenience is concerned, a consumer is the sole proprietor of his/her payment choices. Nobody can dictate their preference; somewhat simplify the process of payment because, in the end, ease of usage wins.

