
We’re back with yet another UPI story! And, we spent some extra time and effort into understanding how India transacted in the month of June. This story is particularly exciting for us to tell because we made some keen observations since there was a dip in the UPI transactions in the month of May.
By now, UPI needs absolutely no introduction. We’ve all used UPI in some shape or form to make a digital transaction. We’re all familiar with Google Pay, PhonePe, and other UPI apps, and we love to use these apps to make payments these days. It’s only fair to observe how India transacts digitally since UPI created a finch revolution in India.
UPI (Unified Payments Interface) being an instant, real-time payments system has pretty much become one of the most preferred payment modes today. Why? Only because of its mobile-first design and approach. Things have gotten so much easier since the dawn of UPI, as far as payments are concerned.
Last month, we talked about UPI transactions falling by 6% in May, at the industry level. And we were as surprised as the next person was. But, considering the pattern that was observed for the last six months, we knew the dip was going to be temporary. Or so, we predicted.
Types of UPI transactions
To understand the trends, let’s talk more about the types of UPI transactions.
- P2P UPI transaction (Person to Person) – transaction made between two people
- P2M UPI transaction (Person to Merchant) – transaction made between a person and a merchant
We considered P2M transactions alone because they better reflect the growth of UPI. This is because P2M transactions aren’t carried out solely for the sake of rewards and incentives. Razorpay, being a payments company, observed UPI based P2M transactions from big names like Ibibo Group, IRCTC, Swiggy, BookMyShow, and many, many more.
We were able to draw some cardinal patterns and observations based on the huge volumes of transactions that took place via the Razorpay platform.
So, what happened in June? Let’s find out!
Since January 2019, we’ve seen a consistent rise in the transactional value as well as the volume of UPI, no doubt. Like we mentioned earlier, we did observe a dip in the month of May, which we predicted would be temporary. And we were right!
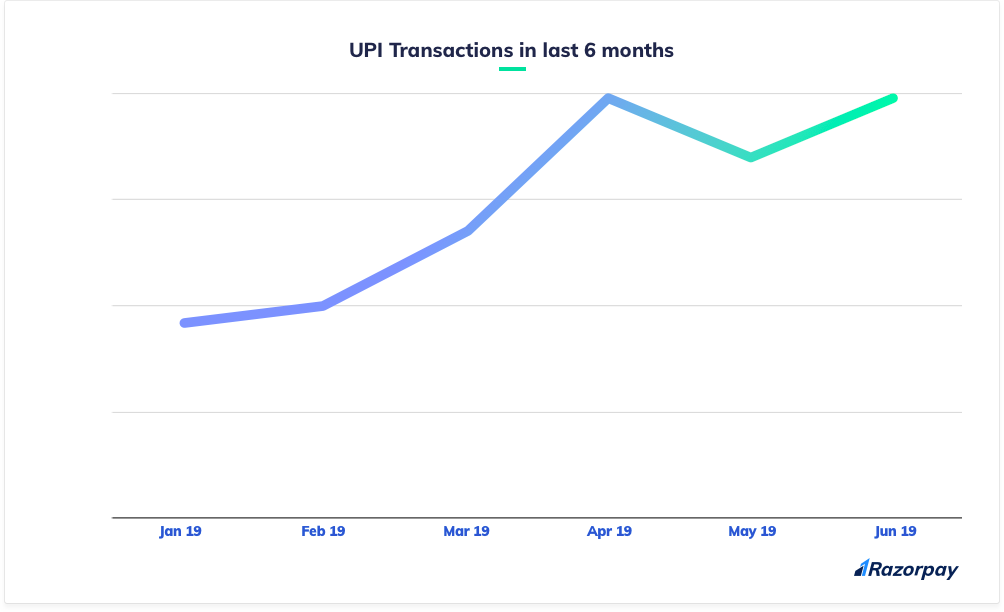
On the Razorpay platform, we noticed UPI transactions having taken a dip by 13% in May, came back to take its place in June. For a moment, let’s completely disregard the plunge in May. In that case, doesn’t the June UPI trend put UPI transactions back on the scale? Definitely!
In that case, May’s UPI trend is a deviation from the pattern. Many factors at the topmost level contributed to this devotion. But now, it looks like UPI is back to settle scores and make up for the lost time.
App wise UPI trend in the month of June – Stating the obvious
Ever since UPI gained popularity, many apps hit the market to facilitate UPI and provide UPI as a service. We all know these apps; we’re all fond of these apps.
UPI apps have made digital transactions like a walk in the park. All you have to do is pick up your phone, enter the payee’s number/ID or scan the QR code. And you’re good to go!
So, let’s take a look at some numbers and understand how much of a contribution each of these UPI apps have made.
We went through high volumes of UPI transactions to identify which app contributed the most.
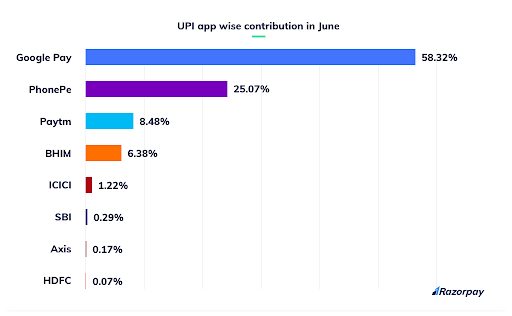
Of course, 58% of total UPI transactions were made via Google Pay, giving the app its rightful place at the top. Remind you; the app has also been consistently on the top of its game for quite some time now. It wouldn’t be wrong to say that it’s not wavering from its place any time soon!
PhonePe contributed a total of 25% of UPI transactions, keeping its second place, the same as the month of May. Paytm went up a spot as about 8% of UPI transactions were made via the app, pushing BHIM to the 4th place as it came through with about 6%.
Our honorary mentions are the bank UPI apps.
ICICI UPI app at 1.22% and SBI, Axis, and HDFC UPI apps maintained the same order as the May month, at 0.29%, 0.17%, 0.07% respectively.
Let’s check back next month to see if this changes!
UPI app wise growth
While we’re talking about UPI’s growth, let’s also look into how much UPI apps have grown.
Taking into consideration the volume of UPI transactions as well as frequency and adoption from the month of May, many UPI apps gained momentum as they bounced back from May’s one-off downward trend.
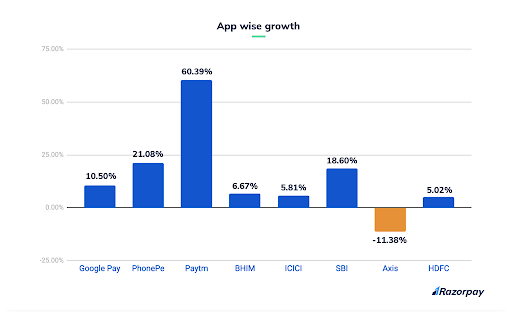
Google Pay saw marginal growth in May, whereas it grew by 10.5% in June. You may wonder, 10.5% is not really a significant number. But it is. Google Pay is the most used and highly preferred UPI app over any other app. Which means, its adoption rates are already up there. So, if the app grows by 10%, it’s still a big deal.
From no growth or rather negative growth, Paytm grew by a whopping 60% in June, while PhonePe grew by 21%.
Amongst the bank UPI apps, Axis UPI app took a blow as it fell by 11%, whereas SBI, ICICI, and HDFC saw a rise by 18.6%, 5.8%, and 5% respectively.
Let’s also remember that the 6% plunge of UPI in May took a toll on the growth of UPI apps, and not the UPI apps itself. Of course, preferences of consumers change from time to time, but since UPI came back to form in June, its growth reflected in the UPI apps as well.
UPI contributions across regions
India loves UPI, and we’ve all established that. But what parts of India transact using UPI the most? We did some digging on the Razorpay platform and here’s what we found out.
- Karnataka contributed 26.49% of the total UPI transactions, the highest throughout the country, out of which 35.62% were made from Bangalore
- 14.91% of UPI transactions were carried out in Maharashtra, amongst which Pune contributed 9.9%
- Telangana took the third place as 11.58% of UPI transactions came from the state, while Hyderabad contributed 13.3% of the total
Let’s take a look at the tier wise split.
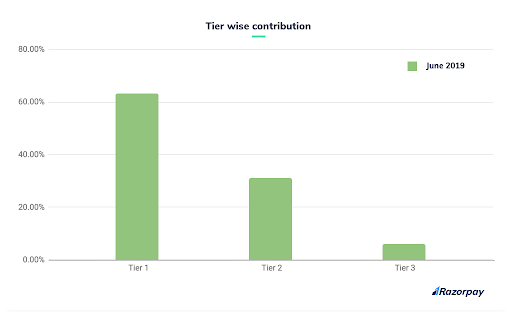
The graph represents that most UPI transactions were carried out in tier 1 cities. Bangalore, as mentioned earlier, contributed the most amongst tier 1 cities by 35.62% while 13.3% of UPI transactions were made from Hyderabad, placing the city in the second place.
Chennai chipped in 7.31% and Pune, being a tier 2 city, contributed 9.92%.
Contributions across payment modes in June
Now that we’ve got UPI transactions covered, let’s talk about various other payment modes.
We took a look at some numbers and drew insights from them as we compared one payment mode to the other. Let’s dive in.
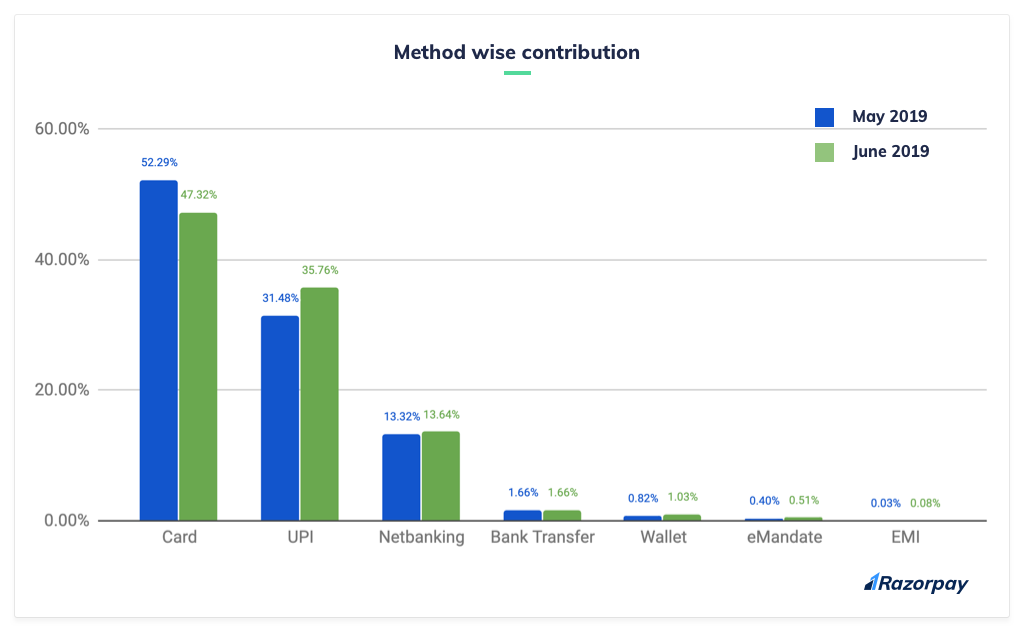
Key impressions
- Same as May, Indian consumers mostly preferred card transactions. 47.32% of the total digital transactions came from debit and credit cards, taking the first spot in maximum transactions made across the country
- UPI transactions went up from 31.48% in May to 35.76% in June, giving its spot in the line immediately after card transactions
- Netbanking saw a slight growth of 5% from May, at 13.64% in June
- Bank transfer also saw a slight growth of 2.7% in the month of June, as 1.66% of the total digital transactions were made via the payment mode
- Wallets, e-mandate, and EMI grew from 0.82%, 0.4%, and 0.03% to 1.03%, 0.51%, and 0.08%
Average Ticket Value (ATV): UPI is still hanging in there
Like we discussed in the last couple of months, Indian consumers are somehow shying away from making large value UPI transactions. This was an inference we made after observing repetitive patterns, and the inference didn’t fail us for June’s ATV as well.
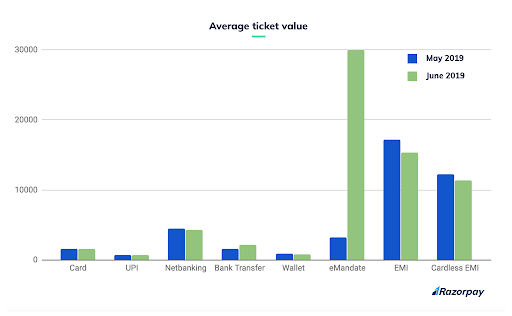
The numbers from contributions across payment modes helped derive these insights concerning the Average Ticket Value (ATV) of each one of the payment modes. Let’s take a look.
- EMI took the most substantial share as it turned out to be the most preferred mode of payments for large value transactions for the majority of Indian consumers
- Cardless EMI followed its close cousin, being the second pick of most consumers, same as the last couple of months
- Netbanking, bank transfers, and card transactions remained to be crowd favourites, right after EMI and cardless EMI
- UPI and wallets took the least priority as consumers chose to make small value transactions with the payment modes
The long and short
UPI has proven itself in the Indian fintech landscape. It’s been reaching significant milestones day in, day out, and it excites us every month to provide updates about its growth.
We can’t wait to see what’s next with UPI in the upcoming months and what an impact it can still make as far as digital payments are concerned.
Let’s explore more of Indian fintech next month! See you all then!

