
2019 was a big year for fintech, especially payments. We saw the rise of many innovations that led India on its journey to becoming one of the most advanced countries concerning digital payments. And, UPI is certainly an innovation that comes to mind when we think fintech.
With the festivities in the air, we wanted to mark the beginning of the new year with a recap of all the cardinal developments of UPI in 2019, along with some noteworthy insights.
Razorpay oversees payments from numerous merchants like IRCTC, Swiggy, BookMyShow, and 8 lakh+ partner business. We’d like to quickly mention that we’ve considered P2M (Person to Merchant) UPI transactions to derive the insights in this report, all of which are based on the transactions made on the Razorpay platform.
UPI in 2019 – a snapshot
2019 was a remarkable year for UPI. We saw many use cases for the payment mode, observed growth in its adoption and analyzed volumes of UPI transactions throughout the year to bring these insights to you.
- For the first time ever, UPI overhauled cards (debit & credit) in September and became the most preferred payment mode
- The most loved UPI app in all of India was Google Pay, displaying colossal adoption and growth rates of 337.73%
- Karnataka was the most digitized state through 2019, contributing the highest chunk of digital payments from all over India
- Bangalore recorded the highest number of UPI transactions from all over India
- Food and Beverage (29%) industry saw the most number of UPI transactions in 2019, followed by Financial Services (12%), and ravel industries (11%)
The upsurge of UPI
UPI was innovated by NPCI (National Payments Corporation of India) in 2016 to help Indian consumers make payments in real-time. What started as a mobile-first P2P (Person to Person) payment mode, quickly evolved itself to become the preferred merchant first platform.
We looked through the UPI transactions made over the years. Here are some findings.
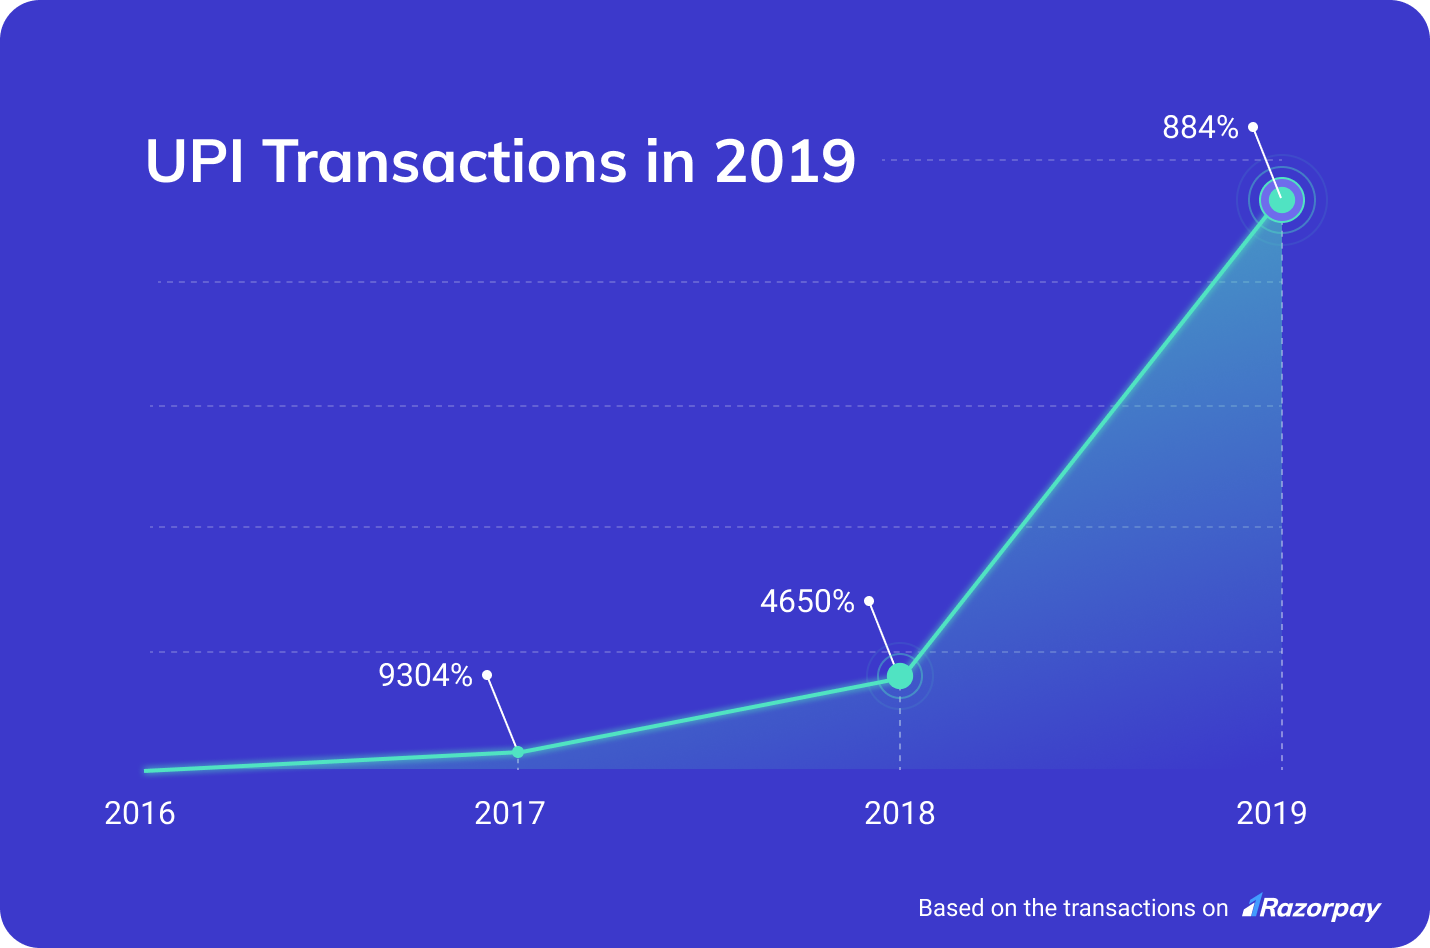
From its innovation in 2016, UPI set foot into 2017 with a bang. Considering all the UPI apps providing cashback, scratchcards, and other offers to promote adoption, the payment mode grew 95 times from 2016. We also saw several players competing to become the most used UPI app, which we will get to in a bit.
When we thought it couldn’t possibly get any better than the 95x growth from 2016 to 2017, 2018 saw 48 times the growth in 2017.
Although the offers provided by the UPI apps played a sizable role, we cannot rule out the change in consumer behavior in recent years. Consumers preferred online payments to be quick, easy and immediate. Compared to other payment modes, UPI was far simpler to use.
The authentication process was straightforward, and the best part – consumers didn’t have to carry anything specific (other than their phone, of course) or remember long numbers. The ease of carrying out a UPI transaction was far more satisfying.
At the beginning of 2019, most offers turned into ‘better luck next time.’ But that didn’t slow UPI down one bit. The year noticed ten times the growth from 2018, still making a massive impact since the payment mode was widely used all over the country.
The ascension of UPI in 2019
Now, let’s take a look into some numbers that show how UPI performed throughout 2019.
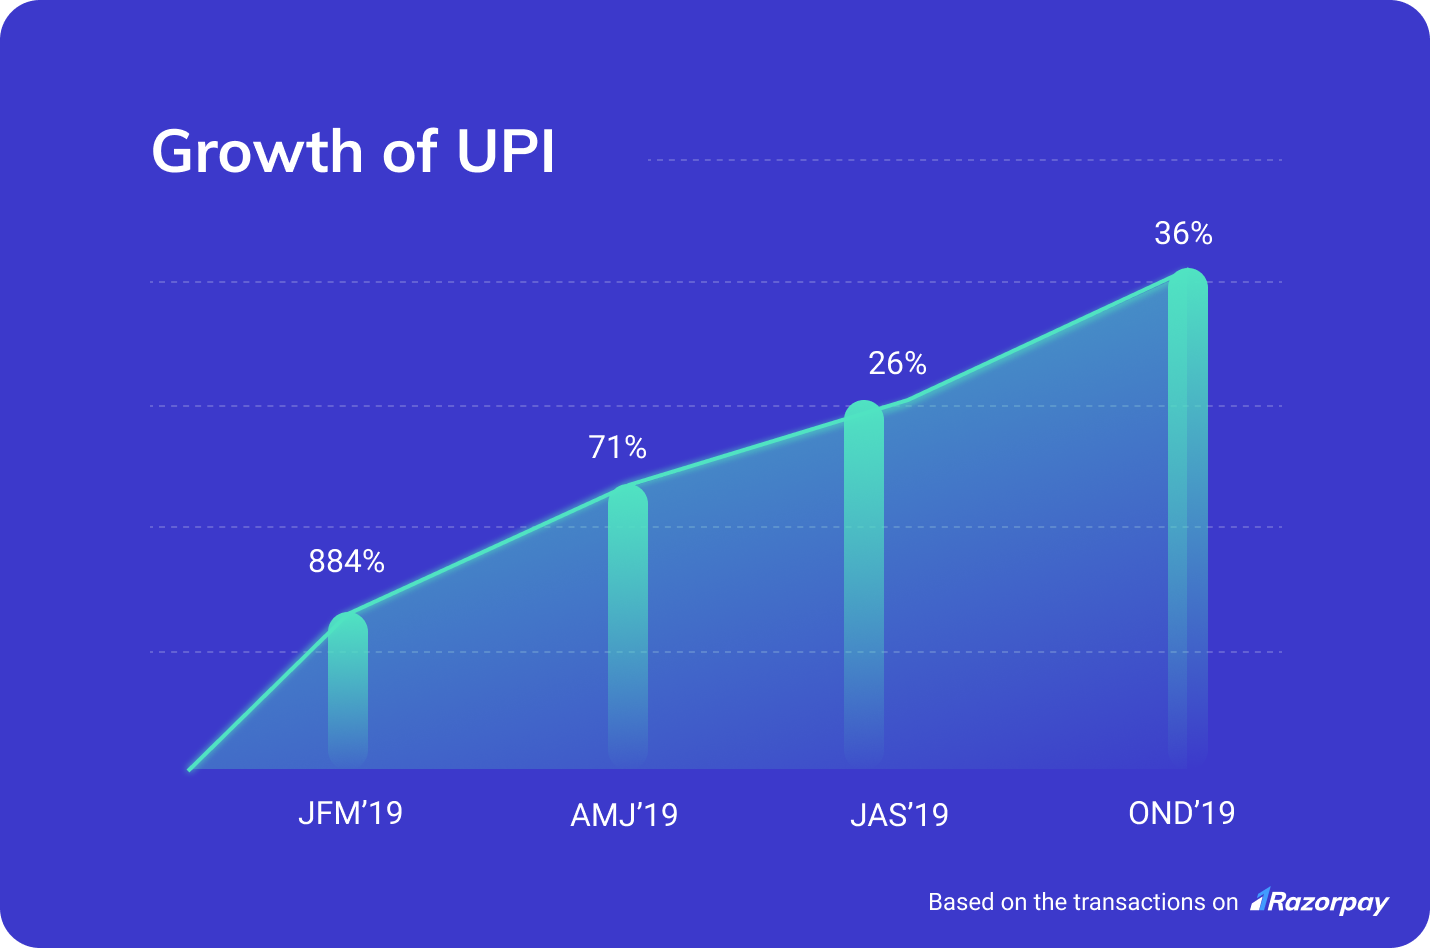
UPI had already gained a firm ground as it made into 2019. In the JFM quarter, the payment mode experienced an uptick of 128% from the previous quarter in 2018. Next, as it made its way to the AMJ quarter, the growth percentage increased by 71% from JFM.
At 26% growth in JAS from the previous quarter, UPI displayed steady growth throughout, venturing into OND with a propelling growth of 36%.
UPI vs other payment modes
While we paid utmost attention to observing UPI, we didn’t forget the other payment modes. Let’s take a glance.
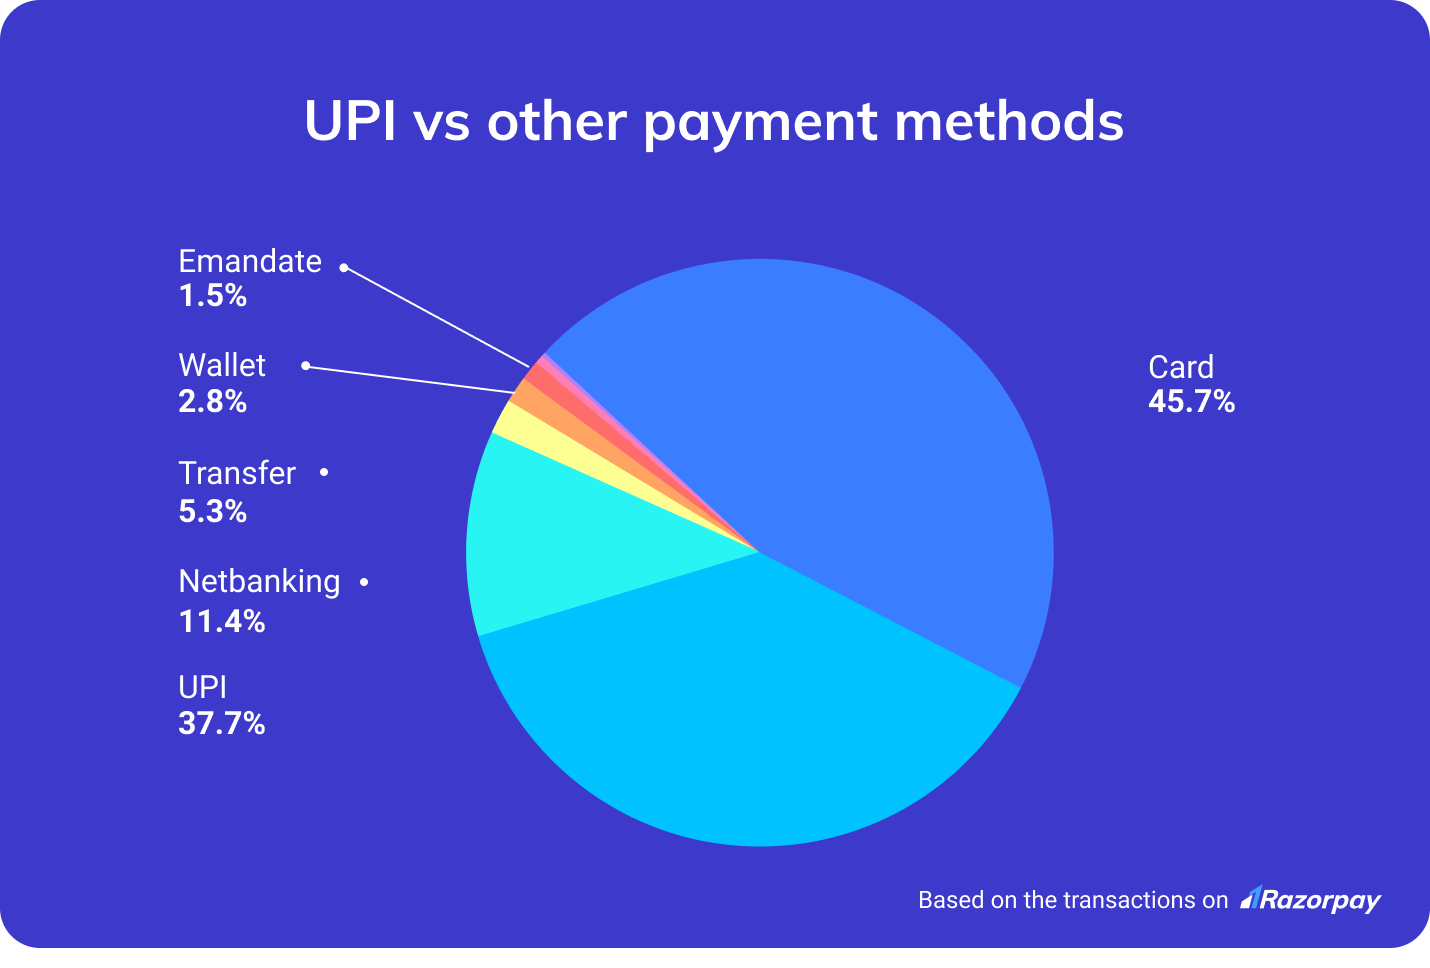
UPI was the most preferred payment mode towards the 2nd quarter of 2019, contributing the most number of digital transactions when we compared month-on-month. When we pooled in the data from throughout the year, we observed that cards took precedence over UPI at 45.73%.
UPI was a close contender, taking second place at 37.69%, followed by netbanking at 11.43%.
Since cards and netbanking were close to UPI in terms of volume, we wanted to take a closer look.
UPI vs debit cards
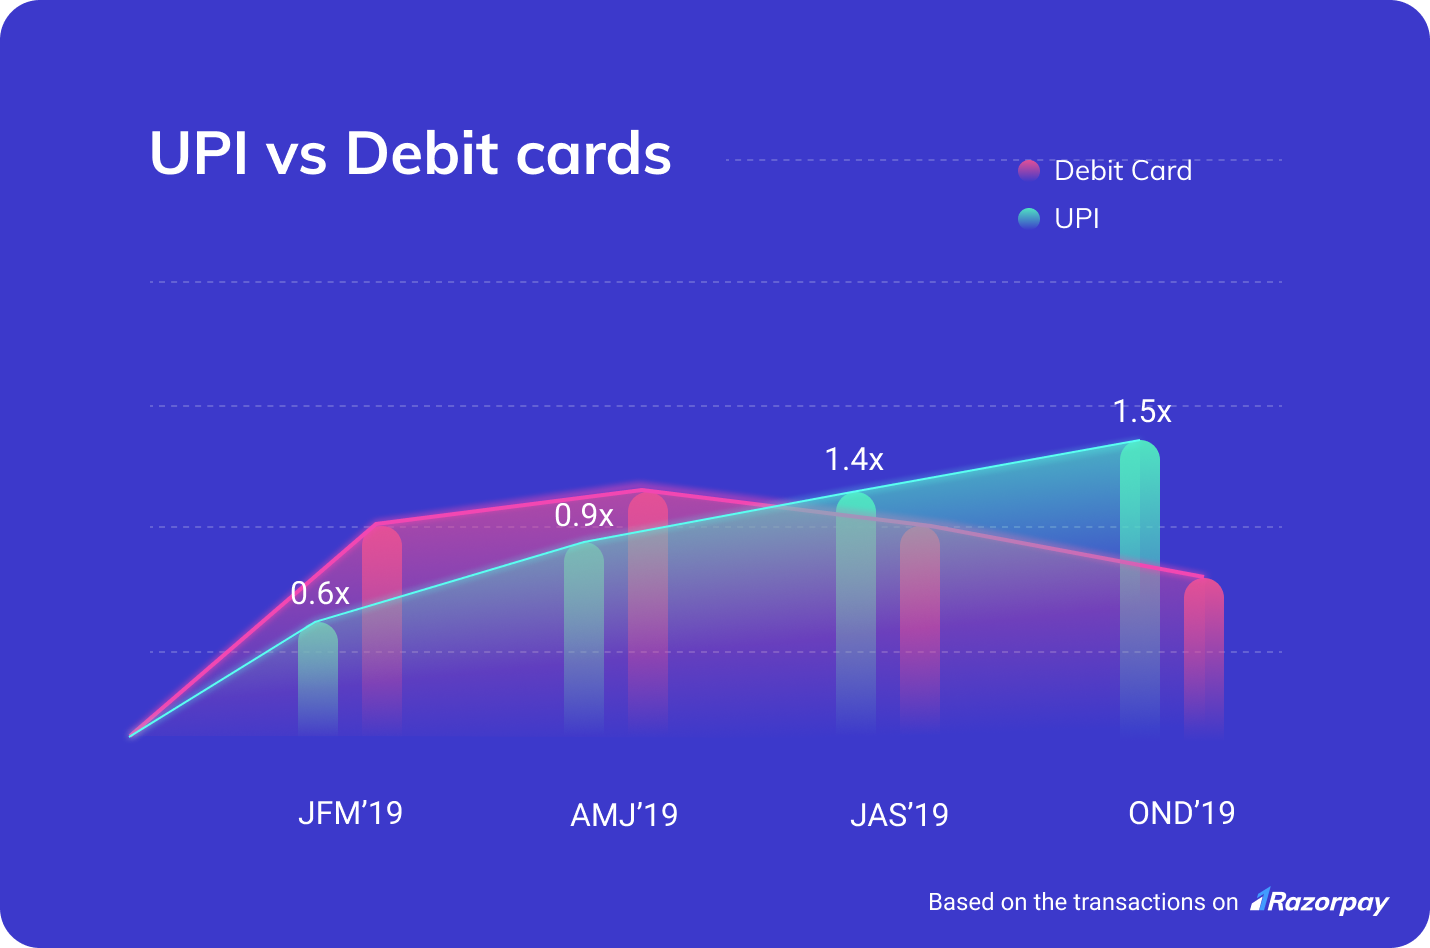
- In JFM, debit cards were preferred over UPI by 0.65% and the trend continued in AMJ, where debit cards were used more than UPI by 0.91%
- This changed in JAS as UPI became the preferred payment mode over debit cards by 1.44% and took over cards in OND as well by 1.59%
UPI vs credit cards
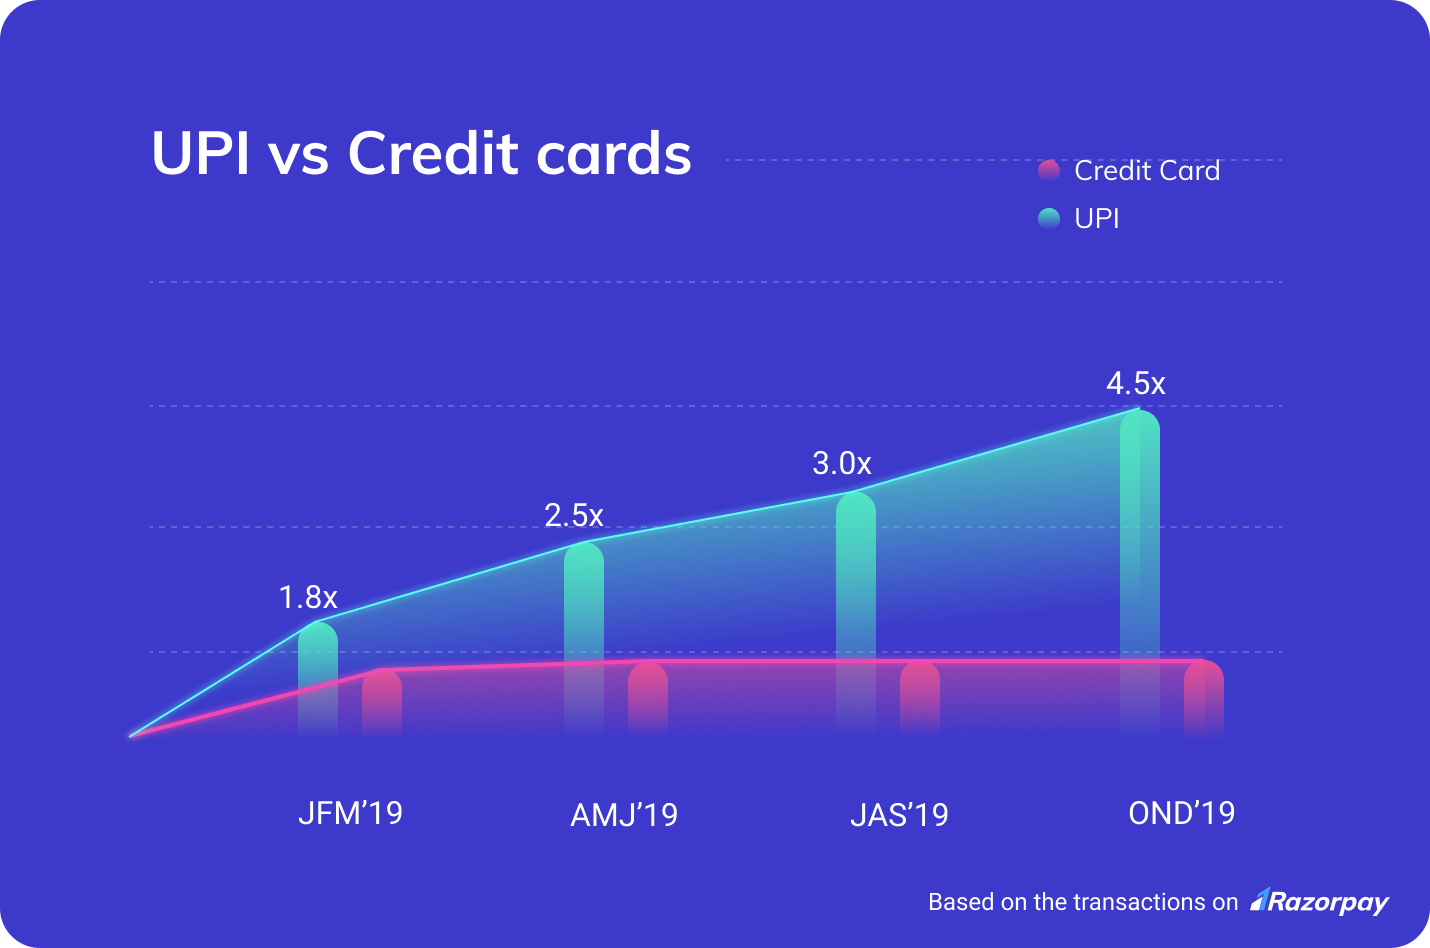
Unlike debit cards, UPI stole the show throughout the year and kicked credit cards to the curb as it transitioned into the most preferred payment mode.
UPI vs netbanking
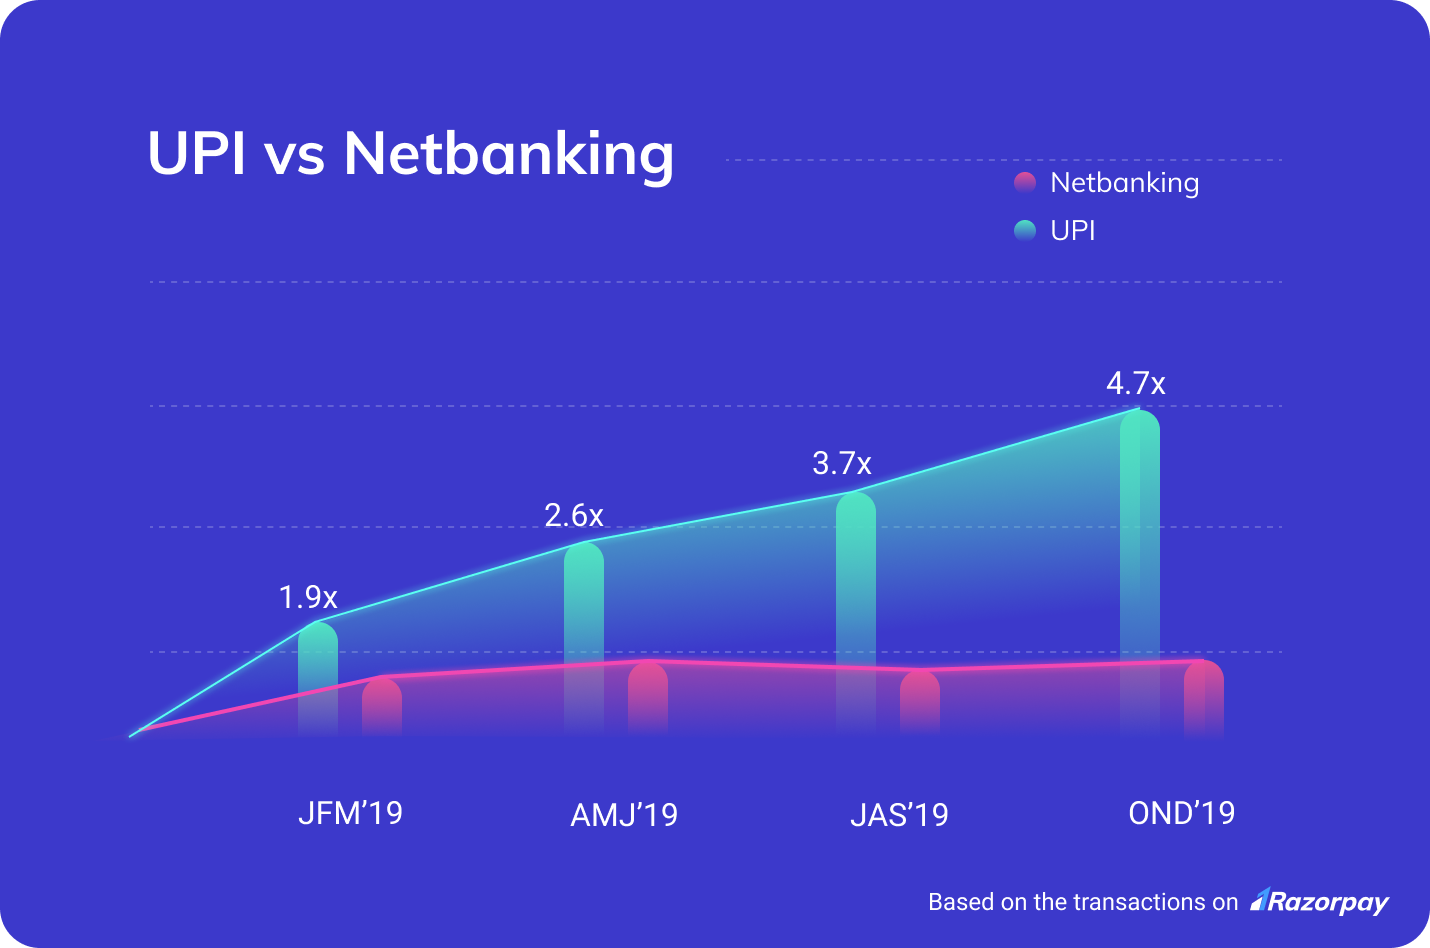
Remember the time netbanking was the most convenient way to transfer money? Not anymore! After overhauling cards, UPI stood over netbanking as well, all through 2019.
UPI transactions – a geographical split
We analyzed the UPI transactions made from all over the country throughout 2019. Here are some highlights.
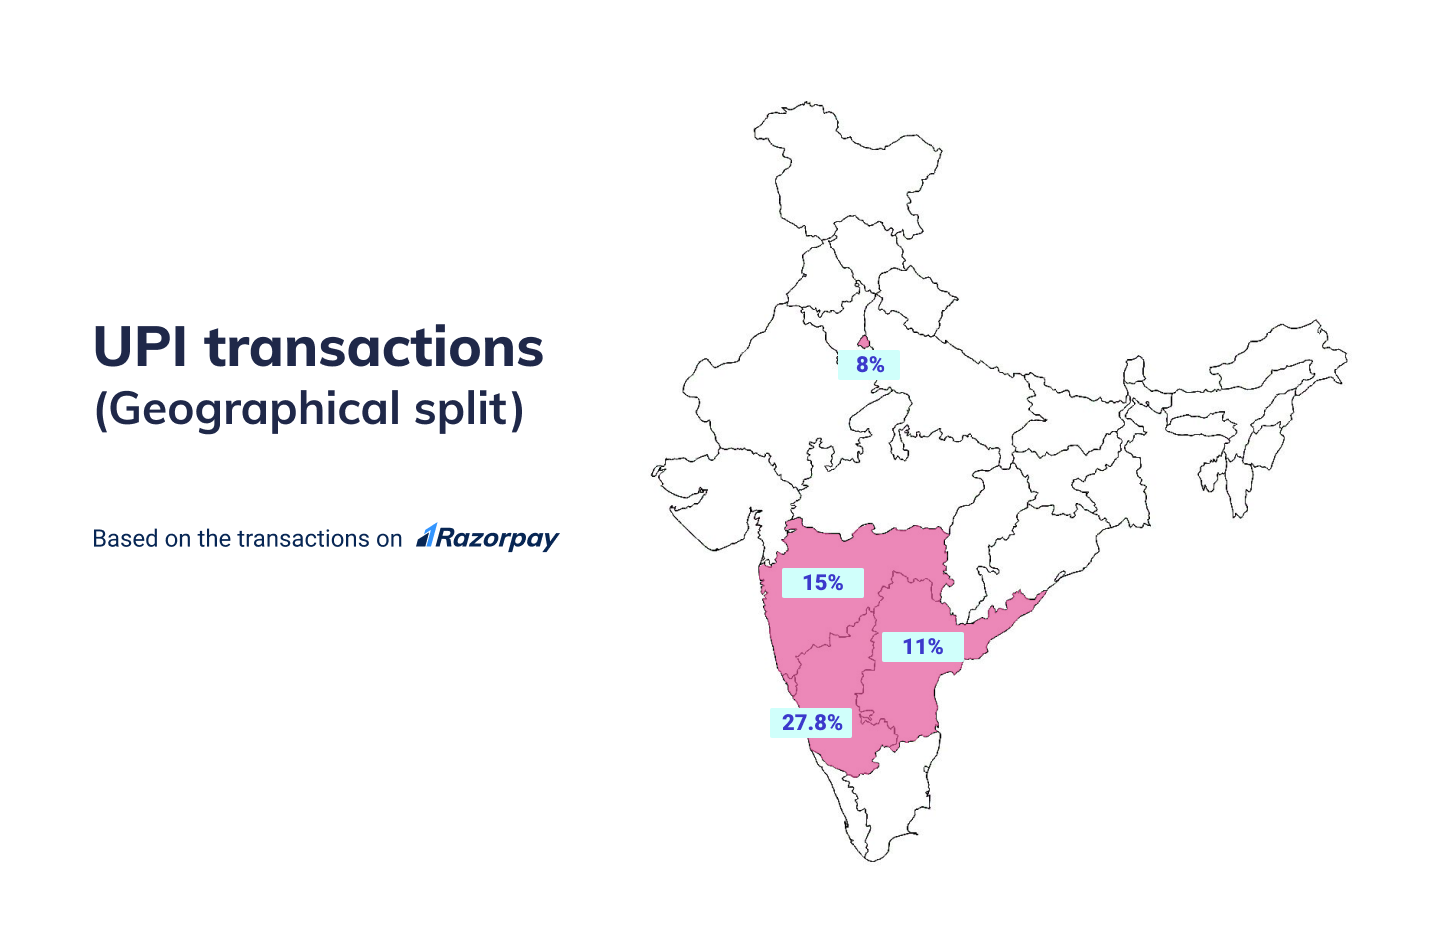
As always, Karnataka claimed its position by contributing the better chunk of UPI transactions made in 2019, at 27.82%. Next up, 15.05% of the total UPI transactions were made in Maharashtra. Andra Pradesh and Telangana pitched in another 11.02%. Further, the NCR region contributed 8.06% of UPI transactions.
This trend remained the same throughout the year as well, when we observed UPI transactions month-on-month.
Now, let’s take a look at a city-wise split.
Again, like many other times before, Bangalore was our #1 contributor as 38.4% of the total UPI transactions were made in the city. Hyderabad followed the lead at 13% while Pune handed in another 9.7%.
Note – Q: Why is Bangalore’s contribution higher than Karnataka’s?
A: The state-wise split is different from the city-wise split. We considered the whole country to provide state-wise data, whereas we considered 15 cities for the city-wise data.
The elevation of UPI apps
So, we learned about how UPI did in 2019. Now, let’s understand how some of our favorite UPI apps fared.
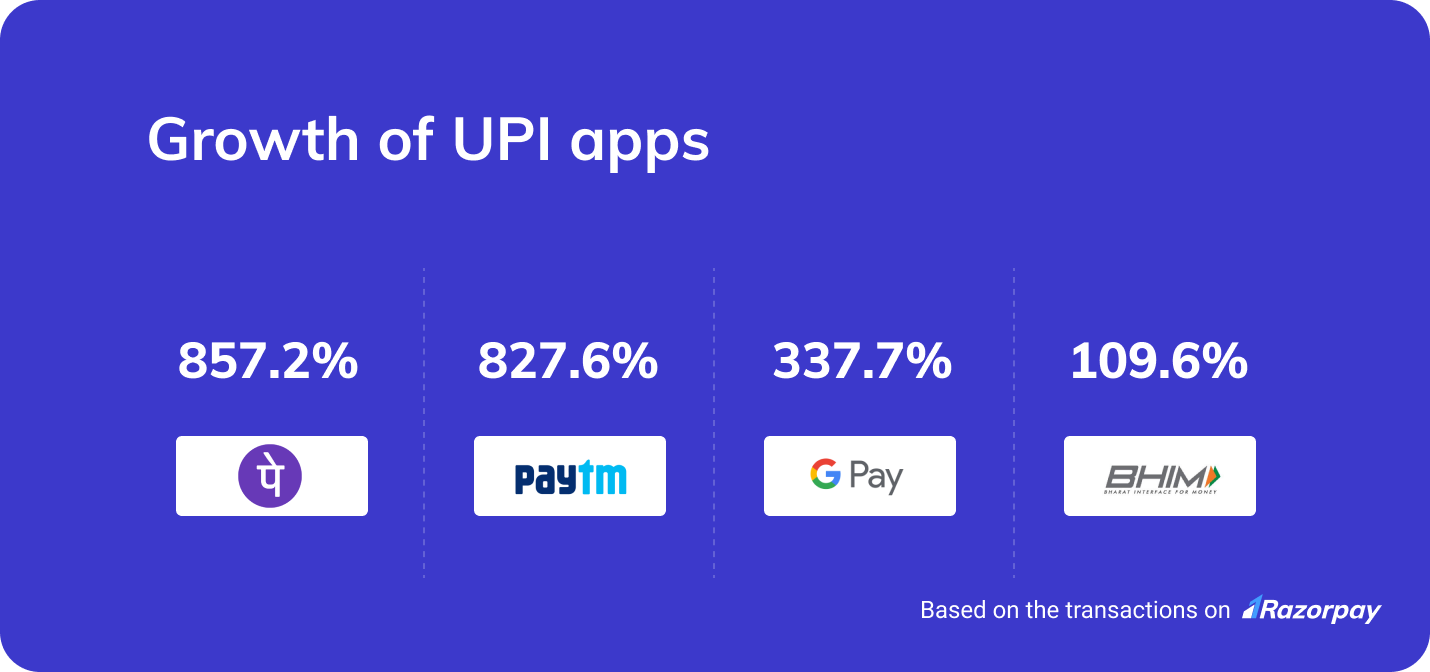
Based on all the UPI transactions made in 2019 on the Razorpay platform, Google Pay took center stage as the most preferred UPI app. The app saw a growth of 337.73%, which is very significant, considering the adoption rates.
PhonePe grew the most at 857.22% followed by PayTM at 827.68%, while BHIM app expanded by 108.68%.
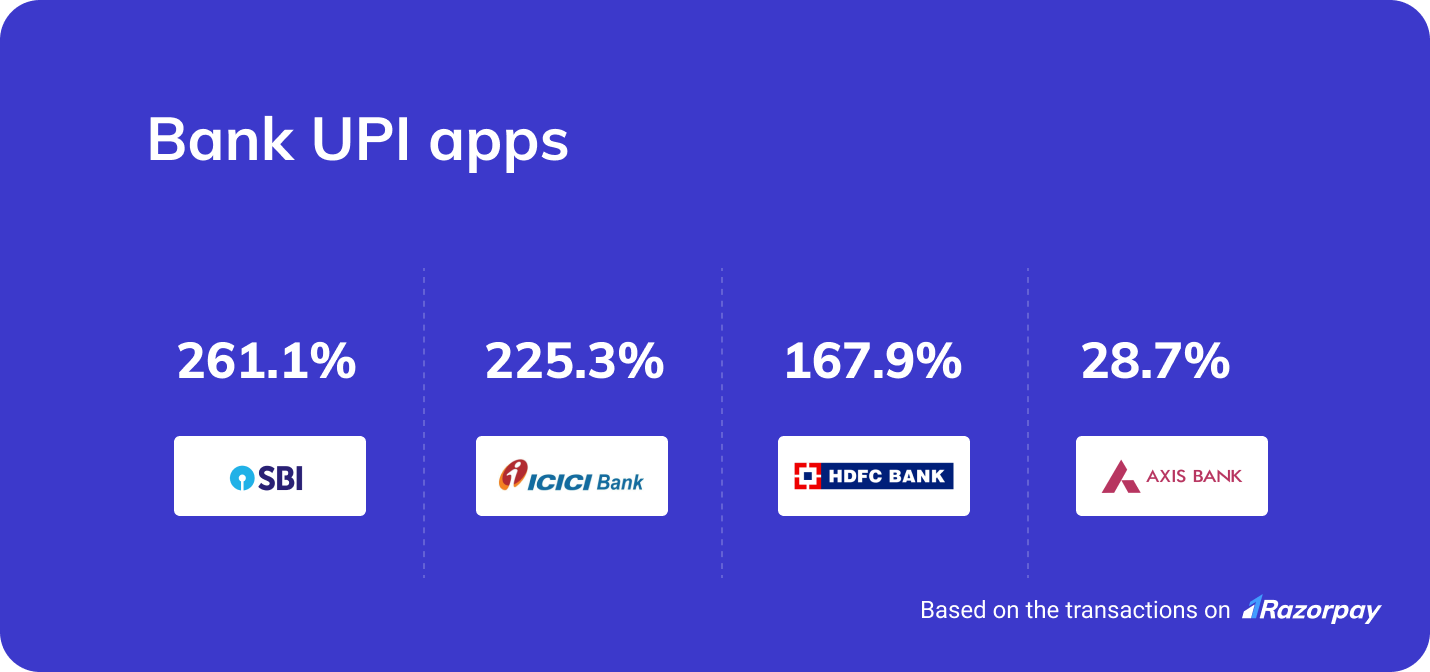
Bank UPI apps also showed promising growth throughout 2019. Here’s a look.
What’s next for UPI?
UPI has been one of the most promising fintech innovations. It didn’t fail to disrupt the Indian payments space, creating an impact we didn’t anticipate.
We expect UPI to permanently dethrone cards and netbanking to become the most preferred payment app in 2020. Based on our analysis, we also foresee an ambitious and competitive market for UPI in 2020, where Google Pay may continue its top position.
Unlike before, Indian consumers are more comfortable using UPI for most digital transactions. We look forward to a paradigm shift towards the consumer confidence towards making larger value transactions via UPI.
We also predict a rising trend in the adoption of UPI in tier 2 and 3 cities.
We’re very excited to continue our analysis on UPI transactions to see new patterns and trends in 2020.
(Note: All findings are based on the transactions on the Razorpay platform from 2016 to 2019.)

