
The secret sauce behind digitisation is the rapid adoption of technology that becomes a solution only after it solves a specific challenge. UPI has been hailed as the future of digital payments in India, a solution that’s adding newness, stirring an uprising of new world order in payments.
And, supporting this digital hullabaloo are the cities that never sleep.
UPI contribution across regions – The numbers will guide us home
Seems like Karnataka has been pushing the right buttons. 30.10% of India’s digital transaction makes the southern heart the numero-uno in UPI transactions. Namma Bengaluru lived up to its name and gobbled 40.06% of UPI transactions among the top 15 cities of India.
Maharashtra has seen a steady flow of 14.37% of UPI transactions, while Pune contributed 8.7% towards the growth.
No rest for the growth rate in Andhra Pradesh, as the numbers pile up to a healthy 11.90%, which makes Hyderabad the second most-digitised city after Bengaluru.
Here’s a Tier wise split infographic.
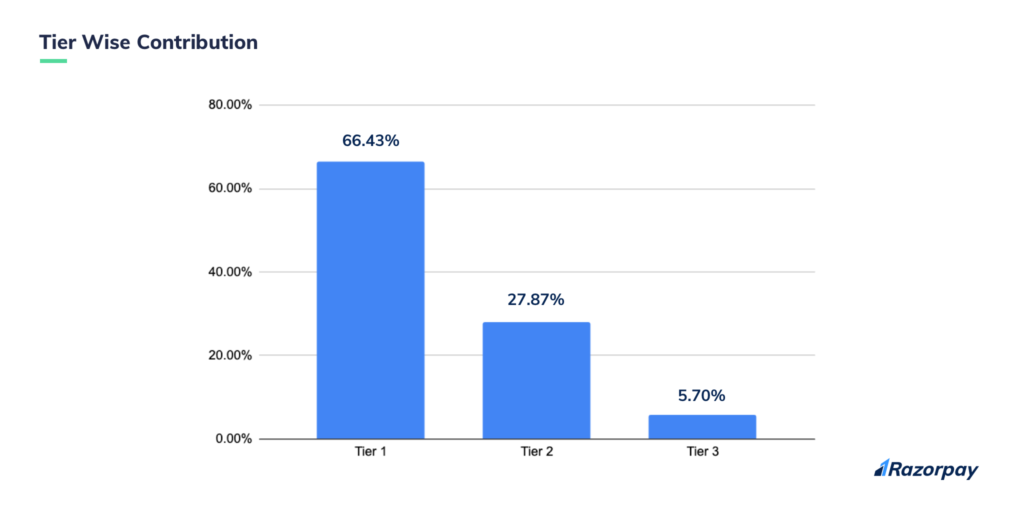
There’s no stopping now. Yes, Tier 1 cities like Bengaluru, Hyderabad, Mumbai and Chennai are adding the necessary fire to the digital economy, which is responsible for 66.43% of UPI transactions in the country.
However, Tier 2 and 3 cities have maintained the order with 27.87% and 5.70% of the digital home run. We also see Pune, Kolkata, Jaipur, Gurgaon and Noida joining the rush.
UPI transaction In the last six months – Days of future past
The rush is for real, and things are about to change. Enough said, let’s investigate the figures from March 2019 to August 2019.
![]()
There’s been a dramatic turn of events in terms of growth, and authorised transactions for August, only shows how UPI could soon be a stepping stone of sustainable growth for an interoperable digital payments ecosystem.
UPI trend In August – Like the Rock of Gibraltar
![]()
As consistency and chemistry go hand in hand, Google Pay, again, rakes in the highest moolah with 59.75% UPI transactions. Yes, sustaining an audience is hard, and someone knows how to raise the stakes.
Whereas, facing the behemoth is PhonePe with an accelerating contribution of 24.91% of UPI transactions. As the numbers roll further, significant players like Paytm and BHIM muster 5.93% and 4.73% respectively.
And, not to forget the banks. To name a few dominant players, ICICI, SBI, Axis and HDFC collectively contribute less than 2% of UPI transactions.
UPI app wise growth – And justice for all
Let’s talk about growth.
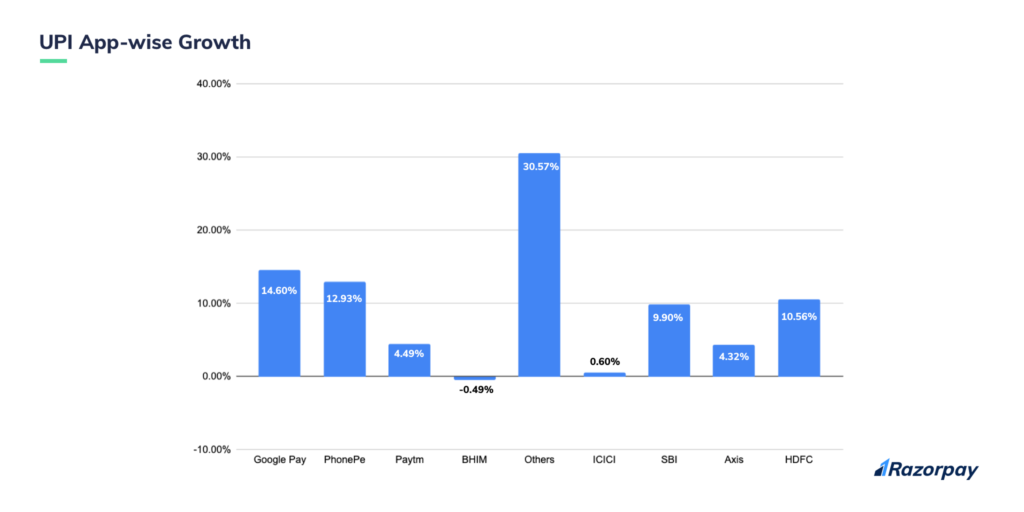
The favourite of the masses, Google Pay has capped a 14.60% growth rate in August. This isn’t all, PhonePe is on the rims to call it even with a 12.93% advancement in this number tear-jerker.
While Paytm has recovered and witnessed a 4.49% improvement in August. In terms of adoption, everyone tasted success except the NPCI powered BHIM app with a negative 0.49% drop compared to July.
And, the tides have turned for the banks as HDFC ousts ICICI from the top spot with a 10 pointer. Whereas, SBI and Axis maintain the ground with 9.90% and 4.32% growth rate.
Contribution across payment modes – Meanwhile, on the flipside
It’s interesting to find that the contribution as well as the growth of the UPI players are on the same rate in August. We can debate all-day-long over plastic money and digital payments, but the preference of the customers do matter.
Let’s see what the numbers say.
![]()
- As far as convenience is concerned, plastic money is still favoured amongst the masses, but it has seen a slight dip compared to 47.10% in July. With 44.10% usage rate, it remains undisputed
- UPI is no more the new kid on the block. A 3% usage increase in August, which takes it to 40.78% – closer to the plastic czar
- Netbanking saw a nominal dip from 12.66% in July and retained the third spot with an 11.37% share
- Wallets, bank transfers, eMandate and EMI saw identical numbers like 1.73%, 1.24%, 0.73% and 0.04%
Average ticket value – At sixes and sevens
According to our insights, customers are clinging to old ways of making large value transaction. Because they are used to it, or they are concerned about the security in UPI transactions.
Let’s face the stats.
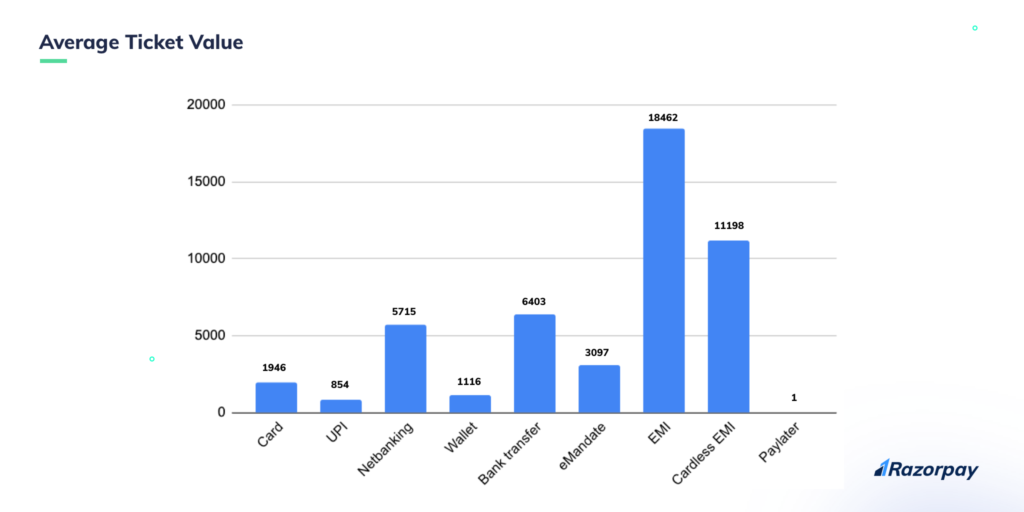
Key pointers:
- The trust factor has increased in EMIs compared to any other payment option
- The cardless EMI payment method has established its own identity, as people enjoy the convenience of making payments with or without a debit or credit card.
- Whereas, the frontiers of their territories: bank transfers, netbanking, cards and eMandate keep a steady pace upwards
- Still unpopular for large value transactions, UPI claims the last spot, which we believe will change shortly
Always forward. Always.
For now, we can rejoice the ascension of the overall UPI transactions, improvement in ATV values and the increase in authorised transactions because the fable is fanciful and pleasing in itself. But It’ll be interesting to see what comes next. Whether or not UPI remains the de-facto mode of online payment, we will be back, only with the assurance of reality.
The data presented here is based on transactions carried out on the Razorpay platform.
This story was first published in Inc42.


