How often do you use Google Pay to book movie tickets or make a payment at a restaurant and hope not to get a “Better luck next time” on your scratchcard?
How often do you scan a QR code at a Kirana store near you to receive a cashback on your Unified Payment Interface (UPI) transaction?
India has come closer to turn into a less cash reliant economy since the dispatch of UPI, which is becoming one of the fastest payment modes to bring financial inclusion.
At Razorpay, we have been doing a detailed study to understand how UPI has transformed the Indian payments scene since 2017.
UPI, which contributed 2 percent of our payment volumes less than a year ago, is now contributing around 20 percent.
I believe the only reason the UPI adoption has increased tremendously is that it’s one of the only instruments in the country today built with mobile-first design and approach.
In our recent report The Era of Rising Fintech, we highlighted how India makes and accepts payments. UPI has now made its way to steal the market share from net banking from being just a wallet killer.
It has also evolved itself into a preferred merchant first payment (P2M) platform, from being just a P2P payment mode in 2017.
Let’s deep dive into how payments were carried out in April 2019, shall we?
Types of UPI Payments
To provide more context, let’s talk about the different types of UPI payments. Transactions made through UPI are of two types.
- P2P (Person to Person): This is how you’d send or receive money from your friend when you split a bill at a coffee shop.
- P2M (Person to Merchant): This is how you’d pay money at the coffee shop to settle your bill.
We’re sure you’ve won some money on Google Pay, received cashbacks on PhonePe, and got many benefits from PayTM. Have you ever wondered why they’re giving away goodies for free? To push adoption, of course!
Most UPI apps gave their users attractive incentives like discounts, scratchcards, and cashbacks, and we saw users referring their friends and family members to these apps. It’s easy to ‘game’ incentives in P2P payments, and that’s why we believe P2M payments are a better reflection of UPI usage trends because there is an intent to purchase something along with the payment.
Since Razorpay is a payments platform, we mostly observe P2M transactions from a wide merchant-base, from many areas like IRCTC, Airtel, and BookMyShow, among 200,000 other businesses. So, let’s look at some numbers from our platform.
Before starting, we do not claim to represent the entirety of available data, but as one of the largest processors of UPI payments in India, we do have a considerable amount of visibility.
Average Ticket Value (ATV): consumers are yet to open up to UPI for larger transactions
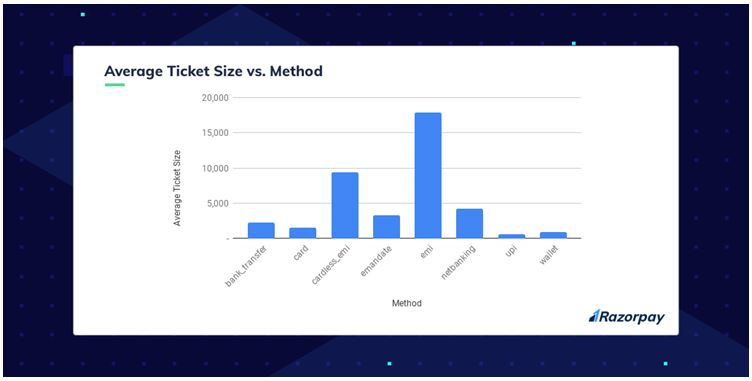
We pooled in data based on all transactions that were made across payment modes through Razorpay and analyzed the Average Ticket Value (ATV). Here’s what we found out.

EMI payments add to the Average Ticket Value by the biggest, although bank transfers have been the preferred way to go for most.
Consumers still pick [what kind] payments, EMI, cardless EMI, and netbanking over wallets and UPI to deal with high-value amounts.
UPI and wallets take a backseat as consumers mostly use these methods to transact smaller amounts of money (Rs 500 to Rs 1,000).
While there’s been an increase in the number of UPI transactions, the decrease in ATV is because the consumers are increasingly opting for EMI/ netbanking methods to make transactions of a larger value.
UPI provider contribution in April 2019: Google Pay takes the prize, again!

With so many UPI apps out there, the battle among them simply keeps getting interesting.
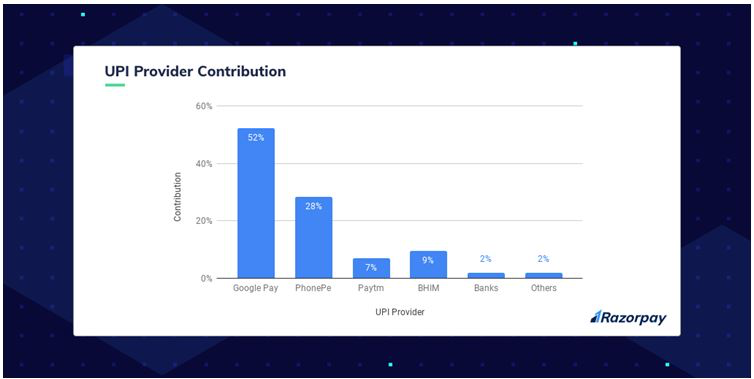
Google Pay maintained the top position with a contribution of 52 percent of total transactions.
We also believe that Google Pay will most likely continue to go strong for many months to come.
PhonePe took the second position with 28 percent while BHIM app took third with 9 percent, pushing PayTM further down the list. There was almost no handout from bank UPI providers, while ICICI did contribute a little.
In April, of the total UPI transactions on Razorpay, 64 percent came from Tier-I cities, going up from 58 percent in January, while Tier-II and III contributed 36 percent of the total transactions, going down from 42 percent.
Suggested reading: The UPI wars – Who’s the Boss?
The elevation of UPI
UPI has been growing over the last two years and tremendously more since the last financial year.
To learn more, let’s compare transaction data from April 2018 and April 2019 and draw a parallel between UPI and netbanking.
We’re sure the results will surprise you!

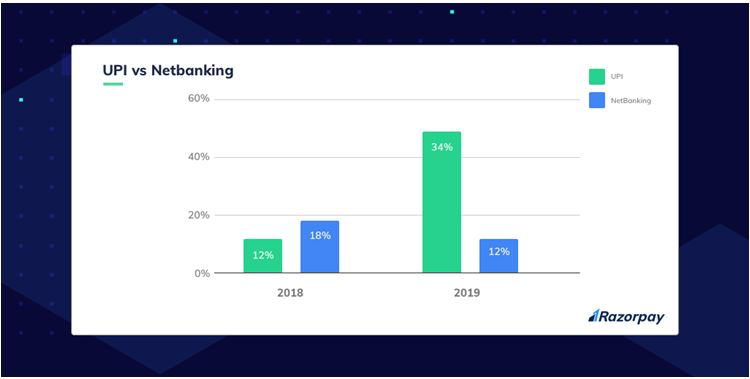
We saw a whopping 20x growth in UPI transactions from April 2018 to April 2019, while netbanking grew only by 4x.
UPI, which was at 12 percent of the total digital transactions shot up to 34 percent in April 2019! And netbanking hit a low of 12 percent in April 2019, from 18 percent in April 2018.
What’s next?
We will also see an increase in the mobile payment volume by tenfold by 2020 and believe 50 percent of internet users will begin to use digital payments by 2022.
We’re looking forward to the launch of UPI on WhatsApp in the next few months as it’s expected to have a significant impact on digital payments, overall.
The upshot
India is still at a nascent stage of digitizing the financial sector although we have scaled up significantly in the last couple of years.
UPI is that one mobile first fintech disruption that has the potential to transform how payments work in India, and we’ve only seen the tip of the iceberg!
__________________
This story was originally published on Yourstory.

