
At Razorpay, we have data coming into our systems at an extremely high scale and from a variety of sources. To ensure and enable that the company can operate by placing data at its core, enabling data democratization has become essential. This means, that we need to have systems in place that can capture, enrich and disseminate the data in the right fashion to the right stakeholders.
This is the first part of our journey into data engineering systems at scale, and here, we focus on terms of our scalable real-time data highway.
In the subsequent articles, we will be sharing our ideas and implementation details around our near real-time pipelines, optimizations around our storage layer, data warehousing and our overall design around what we call a “data lake”.
Understanding data classification
The idea of building a data platform is to collate all data relevant to Razorpay in every way possible in a consolidated place in its native format, that can be later processed to serve different consumption patterns.
And, in this regard, the data platform needs to handle a variety of things (included but not limited to) like data governance, data provenance, data availability, security, integrity, among additional platform capabilities.
In order to do any of the above, we need to understand the nature of the data. At a bird’s eye level, data within Razorpay, will broadly fall into 2 categories:
- Entities: Capturing changes to our payments, refunds, settlements, etc will happen at an entity level where we maintain the latest state (or even store all the states) of each entity in our storage in multiple manifestations that can serve all kinds of consumers later
- Events: Applications (internal, external, third party) sending messages to the data platform, as part of any business processing. And by this, we broadly mean any and every system that ever interacts with the Razorpay ecosystem, which can potentially end up sending data to the data platform. As much as the respective databases can only answer the final state, the events help us understand, how each system/service reached its final state
Evolution and need for a scalable real-time data highway
To understand why we need to build a real-time data highway, and with the explosive growth we have seen, we have constantly been in the quest to answer some of the following questions:
- What has been the result of some experiments we do?
- What is the success rate of different gateways, payment methods, merchants etc?
- How do we make our internal business metrics available to all the respective business and product owners?
- How can our support, operations, SRE and other teams monitor and setup alerts, around the key metrics across different products and services?
- Ability to slice and dice all our products, across 100s of different dimensions and KPIs
What was before?
Before we jump into solving some of our above asks, let us briefly look at what we used to have to answer some of these. We built a traditional ETL pipeline, that queries our application database (MYSQL) on a batch interval and updates an internal elasticsearch cluster.
Not only does this power our customer facing analytics dashboard, but also was fronted by an authenticated kibana dashboard for doing all the above activities. For a certain set of business folks, the data was piped into tableau over s3/athena. For managing the ETL pipeline, we had written a framework on top of apache beam to pull the respective tables, with the joins and transformations, in a composable ETL pipeline. What this meant was simply a matter of updating a few configurations for a new pipeline.
At a very high level, the architecture of such a system, looks like the following:
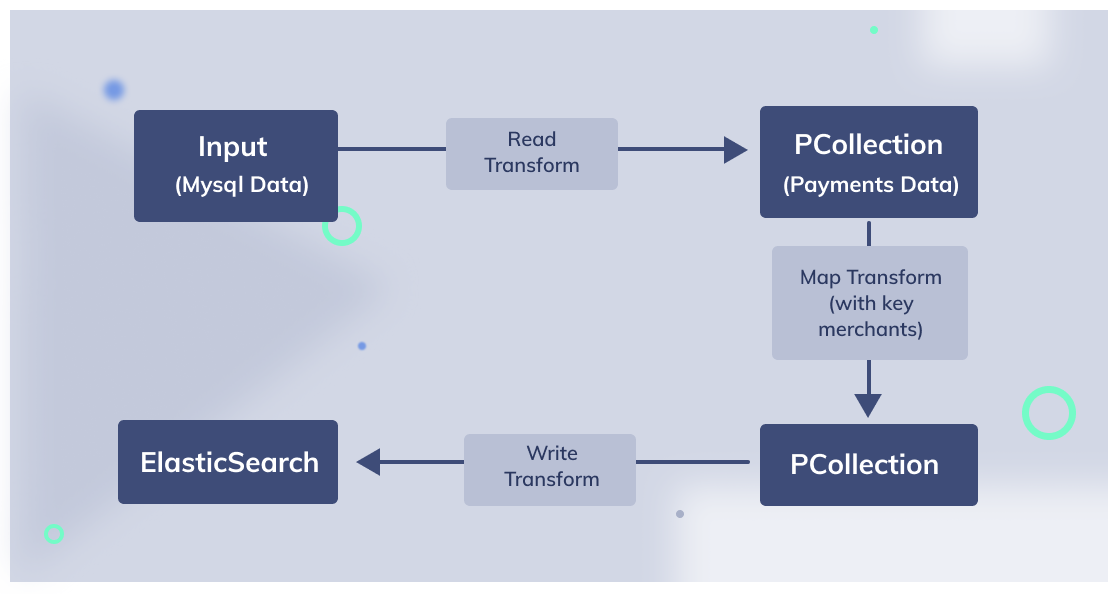
- Input data is read through MySQL in a window period and make a PCollection of payments with payment ID and details as <K-V> pair
- In the next transform, we fetch key merchants and use payments formatter to get output data PCollection
- In the final step, we write the PCollection to elasticsearch.
- Kibana is used as a BI tool to monitor the payment success rates, dashboards
And to serve our customer facing analytics dashboard, we wrote an internal python framework and an API layer that translates an SQL query to an elasticsearch query. As of today, elasticsearch versions 7 and above support built in SQL query. We have, however, been running this framework, successfully in production for over 2 years(much before such a feature was available on elasticsearch) and is serving all our merchant analytics, straight, using the above.
Even with the recent versions of elasticsearch, some our aggregations cannot be directly translated into elasticsearch SQL query format. So, in essence, the merchant/customer dashboard, queries our internal analytics API, using a rest endpoint with the SQL like query, which is converted internally into an elasticsearch query, with the respective aggregations run and presented back to the front end layer for building the visualizations.
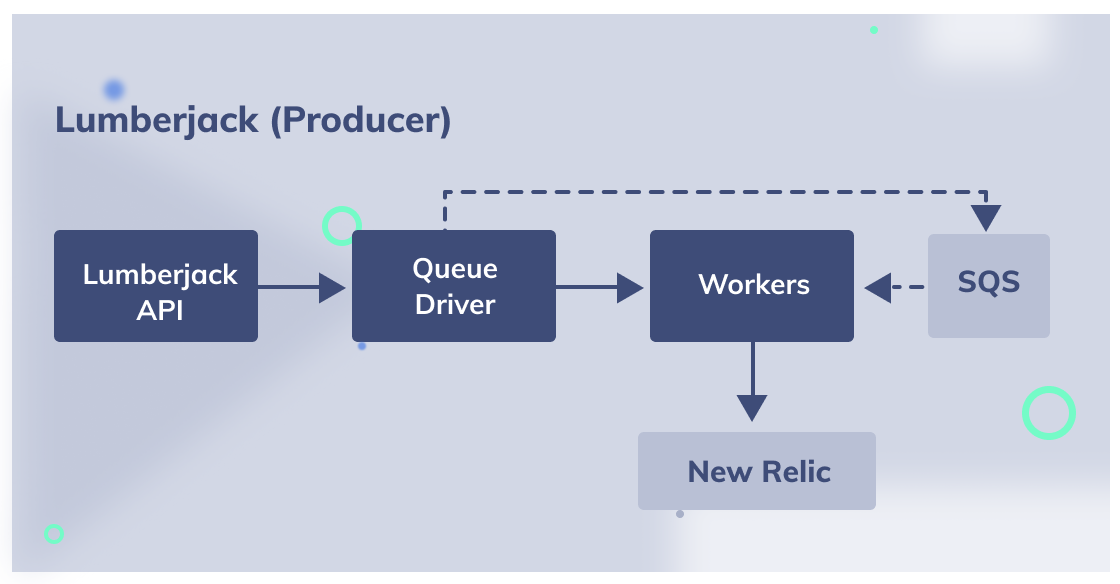
This only solved the need for physical database related changes. In addition to the above, our applications, also emitted events specific to different use cases.
To initially get this working, after trying several expensive tools, we settled at using newrelic insights to power all our events use cases. We have been using newrelic for all our APM use cases and we ended up powering our events and other metrics using insights.
As much as it worked for over 2 years, it started becoming quite expensive. In addition, detailed funneling and long term queries became extremely difficult. More than all, it couldn’t be easily correlated to our database changes, primary due to the fact that the events were real time, while the data capture was in batch mode. Also, joining visualizations across newrelic and kibana was turning out to be painful. In essence, the architecture for this system looked like the below.
The following were some of the additional issues we saw with newrelic:
- Data is locked with newrelic, not easily exportable, data retention for 3 months only (retention is calculated based on usage)
- Some of our funneling queries, produce incorrect results for old data
- Subqueries are not possible
- The number of results capped at 1000 rows max
- Negative funnels are not possible
- Reference to a property from a top-level query in a bottom-level query for the funnel is not possible
- Order of events is not regarded in funnels. While creating funnels, if your funnel says A -> B -> C, even those sessions will be counted for the funnel when the actual order of events was C -> A -> B
- Since newrelic is an external system, any data enrichment(e.g.: key mappings, customer mappings etc) cannot be applied on the fly. Data enrichment cannot be done, post facto. This poses a heavy challenge when multiple services want to enrich a request that spans across different services
- In addition, we cannot maintain any specific lookup tables(if needed) to enable custom enrichments(e.g.: geo ip lookup, mobile device mapping, user agent mapping etc)
What was the problem with the above?
While the above system has been serving all the above needs, it presented us with the following challenges:
- As it is a traditional batch system, we will have delays in terms of being able to slice and dice in real time
- Scaling elasticsearch for heavy business queries was challenging. As a result, we had to setup multiple elasticsearch clusters(for internal and customer facing use cases). In addition, tuning elasticsearch for our needs became a constant challenge
- Data governance: We had to build a whole lot of access control mechanisms on top of kibana to ensure role based access control. Elastic search only supported search guard, which came with its own performance issues
- Joins: Some of our dashboards required us to join across a variety of databases and tables. Elasticsearch, inherently does not support joins. So, the above means, we had to make constant modifications to our ETL pipelines, to ensure we are able to keep our indexes, upto date, based on these every growing needs
- Schema Evolution: In addition to the above, our internal application schema is constantly evolving and for every such evolution, we had to rely on elastic search index versioning and aliasing strategies to ensure data correctness. In addition, this required us to backport data across different indexes
- Cross join events with db changes: As mentioned above, we couldn’t easily do causation-correlation analysis at any given point easily. We had to export reports from each of the above systems(newrelic, tableau, elasticsearch) and needed manual intervention to understand any issues at hand
- Availability: We also wanted all of this data, in some fashion, to be available to our data scientists and that also was turning to be cumbersome. This again, needed multiple different kinds of exports. In addition, the data governance rules become worse to deal with, for all these situations
In addition to the above, we had multiple BI solutions being used internally for different stakeholders:
- Engineering wanted to query through SQL like interface
- Product Analysts preferred custom dashboards
- Business analysts wanted richer visualizations
- Marketing wanted other integrations around Hubspot, Google Analytics etc
In essence, there was a strong need to converge all our BI use cases into a single unified platform. The above issues, were inhibiting us, in terms of exploring and analysing the data within the entire ecosystem. Earlier this year, our product team arrived at a single BI tool, to which all data will be tied to.
Evolving to a real-time data pipeline
Sometime early this year, post the decision on unifying the BI tool, the data engineering team was given the task of building a real time pipeline, served through the unified BI tool for handling the above issues.
The data engineering team was already building a scalable data lake for resolving some of the above issues. However, with the need to handle some of our peak load transactions and improve our operational excellence, the product team prioritized having a real time capability that needed to be exposed to all our internal stakeholders, within the lake.
The long-term idea is to expose these capabilities to our customers, on a real time basis, thereby eliminating our older version of the analytics dashboard. The data engineering team started having a close look at the scale of the problem to be handled. Here is a high level summary of our findings:
- We do several million transactions per day(~100M)
- With just a small fraction of our application stack integrated into the data engineering platform, we are generating close to 0.5 billion events a day
- The compressed size of our data within the lake, at this point was close to 100+TBs.
All of the above, just within a few months of building the data lake!
Lets understand the above in a little more detail, before we present the solutioning here:
- We have a variety of micro services that run as part of our core payment gateway system to handle a single successful payment
- Post a successful payment, there are a variety of other services that handle different post payment processing activities like refunds, settlements etc
- In addition to the above, we have other products that directly and indirectly use the core payment gateway services like subscriptions, invoices etc
- Our front end and mobile SDKs emits a variety of events into our system. We cannot use third party systems like google analytics etc, as per PCI norms and other CORS issues. So, all these events have to be piped into the lake
- Over and above these, our internal micro services also emit events during different stages of their processing lifecycle
To solve all the above issues, we divide our discussion into real time entities and real time events.
Real time entities
Writing to a database is easy, but getting the data out again is surprisingly hard. If you just want to query the database and get some results, that’s fine. But what if you want a copy of your database content in some other system like data lake for real-time analytics?
If your data never changed, it would be easy. You could just take a snapshot of the database (a full dump, e.g. a backup), copy it over, and load it into the data lake. This poses 2 different kinds of problems:
- Most of the data goes through a state machine and hence, the state of the data changes rapidly
- Getting the up-to-date view of this data is challenging in real time.
Even if you take a snapshot once a day, you still have one-day-old data in the downstream system, and on a large database, those snapshots and bulk loads can become very expensive, which is not great.
So, what does the above mean?
- We will need to incrementally load data into a real time streaming pipeline that directly manifests into the lake
- We cannot expose our internal primary database to our BI tool as it stores a lot of sensitive information
- We want our real time stream to be as performant as possible
- We do not want to keep the data in our real time stream for eternity, as its primary use case is around instantaneous monitoring, visualization and alerting
Keeping the above in mind, the data team had made the following assumptions:
- We do not need all of this data for eternity, unlike our traditional OLTP store. So, we decided to store the data as a rolling window update over seven days(1 week)
- We will still want to maintain some basic governing facts loaded here for eternity(e.g. Merchants, customers, card bins etc)
- We will want this system to be extremely performant and being able to query as fast as possible
- Some of the rolling aggregations are fairly complex and needs to be computed with as much data as possible to achieve the desired latency
- We will want the change data to be captured here, as soon as possible
- In essence, all operations on this store will only be upsert operations, as we do not want to keep a copy of any older/stale data
At a very high level, our architecture for solving this problem looks like the following:
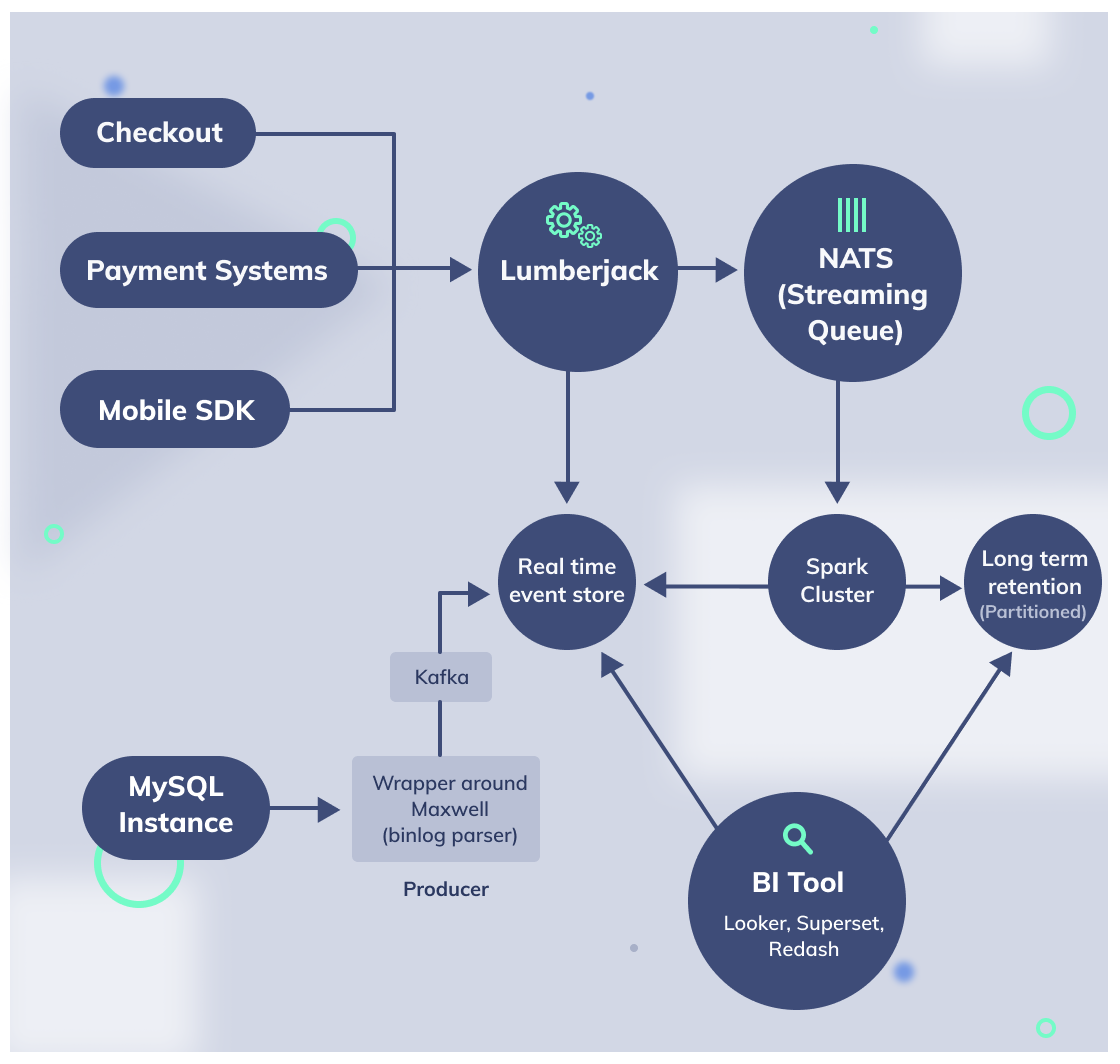
The flow of data will look something like this:
- MySQL Read Replica instance used to pull the data
- We use maxwell to handle the CDC(change data capture) and also ensure, we filter out sensitive information before reading the bin log
- A Maxwell daemon detects change data capture (CDC) to this DB and pushes them to a Kafka Topic
- A spark consumer will now keep reading from the kafka stream and keep batching updates every few seconds(note: the minimum batch duration available in spark is 100 ms)
- Finally, Change data is pushed to the real time data store, where the queries can be executed from the BI tool.
Choice of real-time data store
We did a variety of evaluations on some of the existing data stores for the real-time use case. In essence, we wanted SQL capabilities to be used by the unified BI tool. Most folks within the organization are comfortable with SQL and hence, we wanted something that fits the bill.
After evaluating a bunch of OLAP engines, we arrived at timescaledb as a choice of this engine. Timescaledb is an underlying postgres engine with a timeseries extension. This gives us the ability to not compromise on the SQL like capabilities and also gives some of the advantages over rolling aggregate computation etc. In addition, we will want the operational cost to be extremely lesser with self-healing and auto-scaling abilities possible.
We didn’t want to spend large amounts of money investing in a paid solution like memsql etc to solve these problems. Considering all the above, TimescaleDB seems like a reasonable place to start, simple enough to set up and maintain and seems to meet all the respective criteria.
Real time events
As mentioned above, as of today, only a small fraction of all our workloads(front end systems, mobile SDKs and a few core transactional apps) are pushing events into the data lake. Despite this, the data lake is receiving close to 0.5B events per day.
As you would’ve guessed, with all the existing services pushing events, this number is only going to grow significantly. For a long while, we had an internal event ingestion pipeline(codename: lumberjack), written in go, which primary relays incoming events from multiple producers into desirable targets.
In essence, all that is needed for any app, to tie its events into the lake, just needed to register itself through a configuration. The reason for choosing go over java or others, is to achieve an extremely high level of concurrency, with minimal operating metrics(cpu, memory etc). In addition, this was designed as a heavy I/O bound application, as most work was simply processing, doing minimal validation/enrichment and transmitting events.
We already discussed some of the challenges we had with events being pushed to newrelic. So, we wanted to move all of the events, into a central store, from where we could query using our unified BI tool.
We started making minor architectural changes to our event ingestion pipeline to arrive at the following:
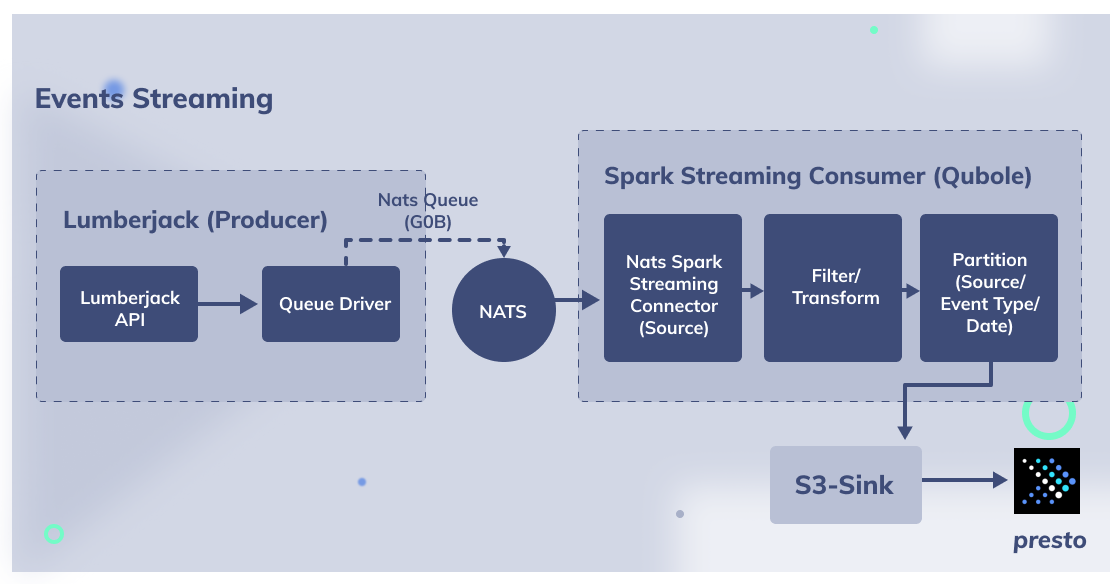
Lumberjack workers: We were originally pushing to aws SQS. We wanted streaming capabilities and SQS was only supporting long poll. So, we decided to move this to Kafka streaming. Kafka streaming gave us the ability to replay and manage offsets effectively.
Consumer : We completely removed the task of pushing events to newrelic. This way, we got rid of the Kafka consumer, which was running on the lumberjack side. We moved to this operation to a spark streaming job, which will read messages from kafka in order of appearance and stream this to an S3 bucket.
Sink – S3: Spark streaming job will sink data for every micro-batch interval, which is configurable. Currently, we have set it to 1 min. Every micro-batch is accumulated in memory, so we can configure the sink interval based on data size. Again, the minimum micro batch interval supported by spark is 100ms
Query execution: We are using presto for query execution. The advantage we get here is sub second responses for a few million records.
S3 – Partition: In order to further speed up the query execution of the events across multiple days, we create daily partitions(msck repair) to ensure the users can query using the created_date as the primary partition key. This has been configured into our BI tool.
Infrastructure setup
Our entire infrastructure for all of Razorpay has been deployed and operated via kubernetes. In essence, except for the spark setup, we run and manage all the other aspects via kubernetes.
So, in essence, maxwell has been running as a deployment, kafka is running as a kubernetes daemonset, exposed to the spark pipelines and timescaledb also has been setup using a kubernetes daemonset backed with a remote AWS EBS volume. Connectivity from the BI tool is enabled to the timescaleDB over NLB and the AWS Security group associated with timescaledb, ensures security over the setup.
The above aside, the spark cluster has been exposed to our BI tool, controlled again via AWS security group and only allows presto queries to be executed. We use prometheus for all our internal metrics.
Currently, since spark doesn’t support out of the box metrics to be injected into prometheus, we have funneled the metrics to lumberjack from spark, which is directly scraped by prometheus and exposed on our dashboards.
Databricks has an upstream patch on spark, but that’s not yet merged into spark core, for pushing prometheus metrics into a push gateway. (TBD: we might need a separate section around metrics here and also add diagrams for infra).
The major challenges
Real-time data challenges:
- Since Pipeline has to handle DDL and DML both logs, so the order of committing the statement to the data lake is very crucial which was a major challenge for pushing data in the same order as it was generated. We have implemented custom logic to create the order by considering the bin log file name and offset of that file. We have an internal schema registry deployed again on kubernetes, to manage the same. This allows us to track schema evolution over a period of time and also ensures we can keep multiple copies of the data, on the lake
- Kafka has slowed down periodically due to limited partitions. This leads to a lag in the data lake, which was fixed by partitioning on unique IDs
- The Dashboard queries performance is bad so we implemented a custom user defined function which aggregates the data in a rolling time window and caches the old aggregate data
- Because high transactions happen in the DB system for humongous tables such as payments, orders, etc. and how transaction happen in small tables like marchent we can not distribute load uniformly across partitions. This leads to Data write performance skew
- Mysql GTID also cannot be used around sequencing in certain cases, and we have built custom sort and de-duplication mechanics to handle out of order events
- Replication delays: In order to avoid AWS inter AZ data transfer cost, and to avoid pressure on the primary databases, we have designed maxwell to read from the replica. As a result, at peak times, if there is a replication lag, our real time pipelines expect the same delay on processing and transmission
- Scaling challenges around timescaledb: At the moment, timescaledb inherently dosen’t support clustering options. We plan to move this layer either using kubedb into a clustered mode, or perhaps use other mechanisms to ensure we have better clustering / MPP kind of execution
- In addition, we can cut down the spark processing time, by moving this pipeline into flink, which can directly stream kafka to timescaledb endpoint
Real-time entities challenges:
- Since the events are pushed in small micro batches, this leads to a lot of cost overhead on S3. In addition, during query execution, we were bitten by hadoop’s small file problem. We are still balancing the right micro batch interval
- In addition, we wanted to have a unified way of keeping this data. So, we plan to move the immediate events into the real time data store and eventually sync up into the partitioned tables, on a daily basis
- With the above change, we can quite simply move the spark processing to flink processing, where the flink jobs can directly stream to the timescale db endpoint and spark process the daily batches with partitioning.
Learnings and pitfalls
- To replicate MYSQL DB transaction in the correct order on a Non-MySQL datastore, for ordering the DB transactions and replay the events a combination of GTID, XID, event types (commit start and end ) need to be used
- Spark streaming has a lot of overhead and doesn’t play well when used with small batch sizes (millisecond level, that’s why we moved to seconds level batch)
- Running SQL queries from spark carries a lot of overhead. We need to instrument the right metrics, analyze queries in a timely fashion and enable the right kind of caching for optimizing the queries
- A large portion of our data lake is built on aws s3. This comes at a significant cost, if not tuned well. For instance, the s3 data transfer cost, bit us quite badly a few months back. As a result, we had to go through significant infra optimization, enable vpc endpoints among others. Cost optimization, continues to be an ongoing exercise
- Optimizing S3 by itself, has posed enough challenges for us. As we mentioned earlier, in the subsequent posts, we shall enlist our learnings, observations and the work we have done to optimize these
The road ahead
As much as we have been able to build some of these things at an extremely efficient scale and operationalize it, our journey doesn’t stop here.
It has in fact, just begun.
In the subsequent posts, we shall talk around the journey of our data platform, data lake, non real time use cases, optimization techniques adopted among a variety of subjects.
Our journey thus far, on the data side, hasn’t really been that smooth. We have failed, learnt and recovered. On the other side, some of the most challenging problems we have faced, has been a lot of fun to solve too. We wish to learn and share our learnings through these.
If you are interested in working with us or solve some exciting problems, please reach out to hiring@razorpay.com or visit our careers page.
Authors: Birendra Kumar (Head of Data Engineering, Razorpay) and Venkat Vaidhyanathan (Architect , Razorpay)


