In September, UPI went past cards and other popular modes to become the most preferred payment mode. We were stoked to see the switch, and curious, too. But the glory wasn’t a stroke of mere luck; it was an inevitable ascension of UPI as the de-facto mode of online payments.
One v/s the rest
In October, UPI was responsible for 50% of transactions on Razorpay’s platform–surpassing cards by a 15% margin.

In September, cards contributed 42.56% of digital transactions, but in October it fell by 6.89%, which amounts to 35.67%.
UPI transactions on Razorpay’s platform has maintained a consecutive growth of 11.02%, month-on-month, from September to October.
Let’s check it out!

Everybody wins

Leaving the footprints to be remembered in the digital payment landscape is Google Pay with 61.19% of UPI transactions.
Whereas, PhonePe is standing as a strong contender with a contribution of 24.95%. As the numbers twirl, other players like Paytm and BHIM contributed 9.5% of UPI transaction.
Also, big banks like ICICI, SBI, AXIS and HDFC sweeten the kitty with 1.08%, 0.31%, 0.14% and 0.06 respectively.
The banks are back for their bucks
Let’s talk about growth!

Surprisingly, the government-backed BHIM which saw a meteoric growth of 31.17% in September, which declined by 10.06% in October, while the rest of the players enjoyed an upward growth.
Cutting through the noise is the favourite of the masses, GooglePay has capped a 9.92% growth rate, mostly being the choice of the customers over any other UPI app. Sitting tight in the second spot is PhonePe with 16.61% growth while Paytm chips in 9.58% of the surge.
But the story doesn’t end here!
This time there’s been a significant upturn, the bank apps are here to lock horns with the new school players with numbers like 16.61% (Axis), 15.18% (SBI), 14.36% (ICICI) and 7.61% (HDFC).
That makes it a 53.76% growth for October alone!
Haryana barges into the UPI club
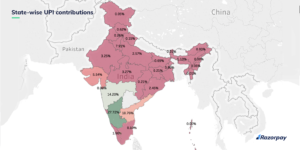
Now let’s shed some light on the states that have contributed maximum to the cashless economy.

Karnataka has been the top contributor in UPI transactions for consecutive months, the southern state is responsible for 27.72% of total transactions in the country.
Seizing the second spot is Maharashtra with 14.20% of UPI transactions. Whereas, Telangana and Andhra Pradesh gave away 10.76% collectively. Finally, Haryana entered the UPI club with a gracious 7.91% of UPI transactions.
Let’s pause and talk about the cities that keep the engine running.
Bengaluru has carved a niche for itself with 38.1% of UPI transactions, which shows its residents are way ahead of their counterparts in terms of choosing their payment option.
Well, this doesn’t mean Hyderabad and Pune are going to hang their boots! The ‘City of Nawabs stands tall with 12.5% whereas the ‘Queen of the Deccan’ bats it out with 9.5% of UPI transaction.
Also, tagging, along with Ahmedabad (4.3%) and Jaipur (4.0%) are Kolkata (3.5%) and Bhubaneswar (3.3%).
Let’s talk about tier wise contribution…

You can see Tier 1 cities like Bengaluru, Hyderabad, Mumbai (6.78%), Chennai (5.86%), Kolkata (3.74%), Delhi (6.41%) and New-Delhi (3.81%) drawing a mark in terms of UPI transactions, which totals to 62.87%.
Tier 2 and 3 cities contributed 30.97% and 6.16% respectively.
Note: In case you wonder about the numbers: the state and the city split is different
The view is better at the top, but…
Do you remember when it all started? The expectations and jargons and predictions that rocked UPI’s boat. Well, we have reached the shore now, and this time, the sky looks pink.
As they say, the fable is fanciful and pleasing, but there are miles to go before we sleep.
Note: All findings are only based on transactions held on Razorpay platform in October 2019
Data from this story was also published in The Times of India.

