Surprising, isn’t it? Only last month, we were talking about the unbelievable growth and adoption of UPI throughout the country.
And, recently NPCI data revealed a 6% dip in UPI transactions at the industry level.
It may be so, but as we spent some time looking into the numbers, we also understood that it may be a one-off situation. Read on.
We all use UPI for pretty much everything. From buying groceries to paying rent, from paying for cab rides to enjoying some hot coffee at a local coffee stall. UPI has definitely changed the way India pays today. And, the numbers have always left us awestruck. The country did see a remarkable digital transformation as far as payments are concerned, and the transformation is still processing, reaching new heights.
Over the last two years, UPI has evolved itself into a preferred merchant first payment (P2M) platform, from being just a P2P payment mode in 2017.
We use UPI for two kinds of transactions – P2P (Person to Person) and P2M (Person to Merchant). Although P2P transactions are higher in volume (because of the fact that UPI apps incentivised referrals through cashback and discounts), let’s consider P2M transactions. The latter reflects an unbiased picture of UPI growth as P2M transactions go beyond scratch cards, incentives and rewards.
Being a payments platform, we observe UPI based P2M transactions from over 200,000 businesses such as Airtel, BookMyShow, IRCTC, Zomato, and more. Basis huge volumes of transactions, it allows us to observe patterns and derive new insights.
So, here are some pivotal observations we made in the month of May, on Razorpay’s platform.
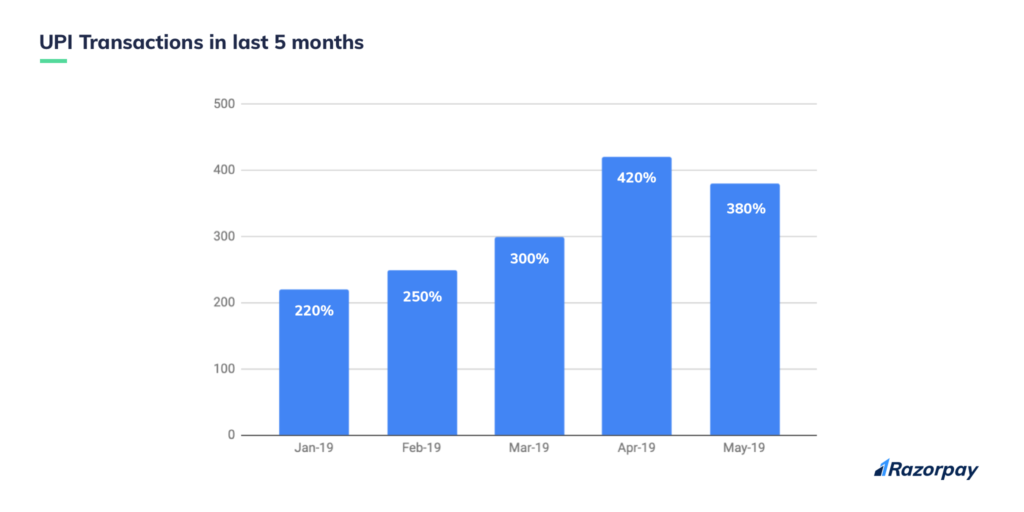
UPI transactions in the last five months
We compared UPI transactions from January 2019 to May 2019.
The transactional volume and value saw a consistent rise till April as the numbers kept increasing in a gradual manner, as predicted.
But, when we looked at May, the pattern broke. The rise was not gradual anymore because the month saw a dip by 13% for the first time since the advent of UPI. It may seem astonishing to think of it initially, but it does make sense to some extent.
We put our thinking caps on and inferred the skyrocketing numbers in April don’t really negate the fact that UPI has been seeing new heights. The comparison between March and May supports that UPI has been flourishing.
UPI trend in the month of May – No prizes for guessing!
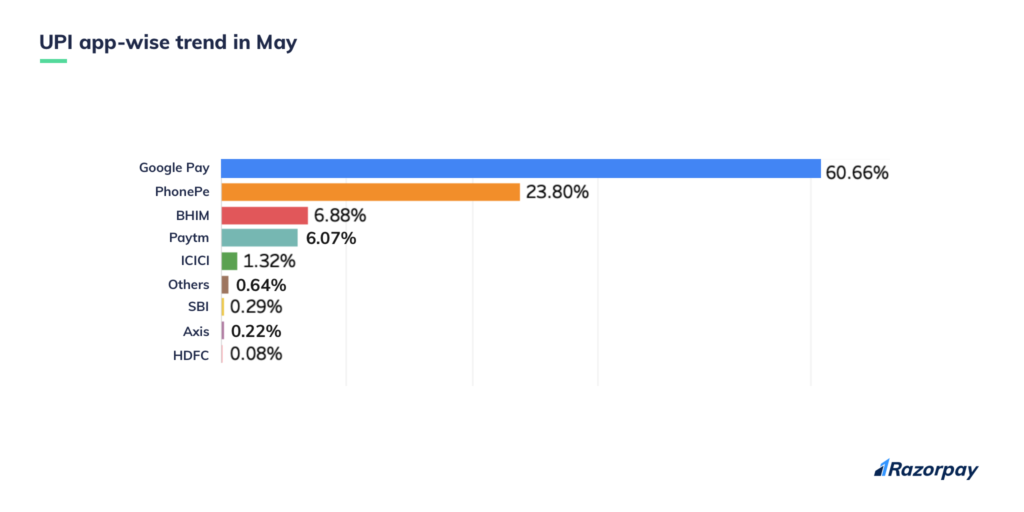
There are one too many apps in the market that provide UPI service. We analysed the transactions that took place on Razorpay via each one of these apps to see which app was the cherry on the cake.
No surprises here. You must already know by now.
Google Pay stood tall as it was the only UPI app that was used predominantly by consumers, over every other app!
We saw a smashing 60% of UPI transactions were carried out through Google Pay. This has also hit an all-time high in May! April saw 51% of UPI transactions while March, February, and January observed 57%, 53%, and 53% respectively.
The second highest number of UPI transactions came through PhonePe at 23% (down from 28% in April), while BHIM contributed close to 7% (down from 9% in April) of the total UPI transactions in May, taking the third place!
ICICI UPI app was mostly used compared to the other bank based UPI apps, at 1.32%, while others were used even less frequently.
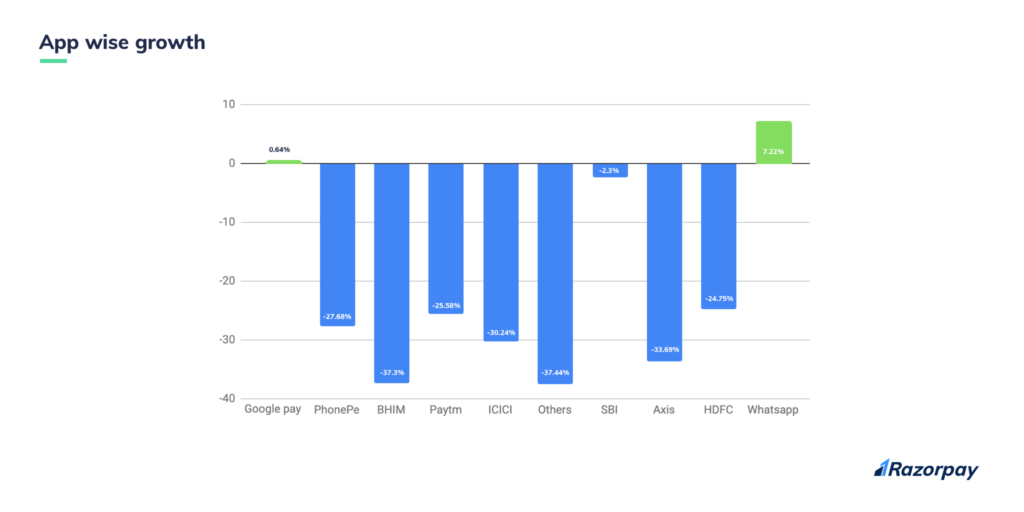
While we’re still talking about UPI trends, let’s also take a look at the app-wise growth.
In terms of adoption and usage, Google Pay, the preferred UPI app witnessed a small growth of 0.64% in terms of adoption and usage. This may seem insignificant but isn’t so, since the greater number of the population prefers Google Pay over the others.
BHIM took a massive blow as it fell by 37%, being the highest plunge downwards in the month of May. PhonePe took a hit by 27% as WhatsApp saw itself climbing up the ladder to see the summit at 7%.
Why, you ask?
Google Pay is rapidly growing mainly because of its higher success rates (65%) compared to the other UPI apps.
Now, Let’s look into the overall digital transactions that happened in the month of May, on the Razorpay payments platform.
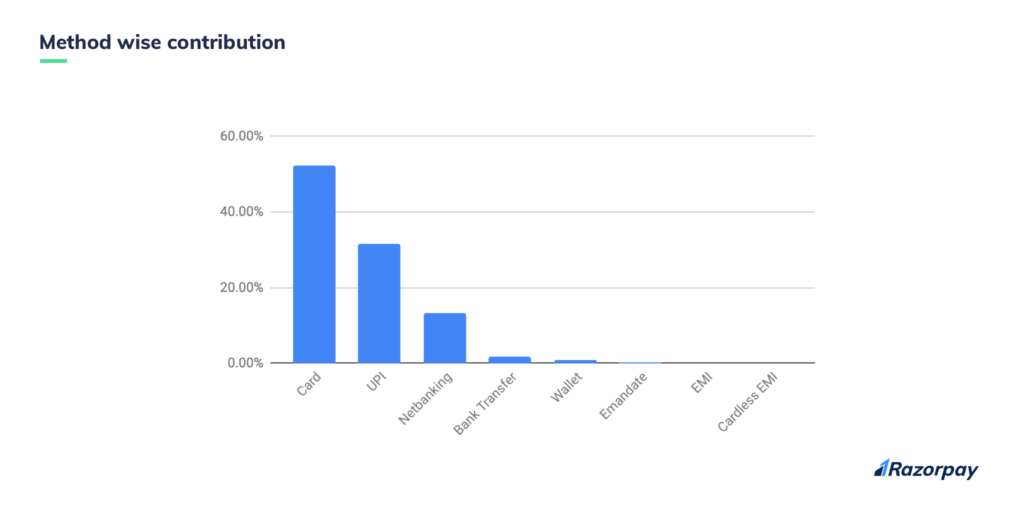
Contribution from different payment modes
More numbers, more insights. Let’s jump in, shall we?
We’re not talking about UPI alone anymore, but other payment modes as well. We spent some time analysing transactions across modes to compare and contrast one another. Here’s what we found out.
Key takeaways
- Card transactions took the first slot by contributing 52% of the total number of transactions on Razorpay’s platform, but still went down by 4.5% from April
- Close to 32% of transactions were made through UPI, which also saw a fall of 13% from April
- Netbanking saw a growth of 8%, as 13% of the total transactions were made through the payment mode
- Bank transfers grew by 95%, contributing 1.66% in May, from 0.81% in April
- Wallets, e-mandate, EMI, and cardless EMI experienced growth by 15%, 6%, 22% and 12% respectively, from April.
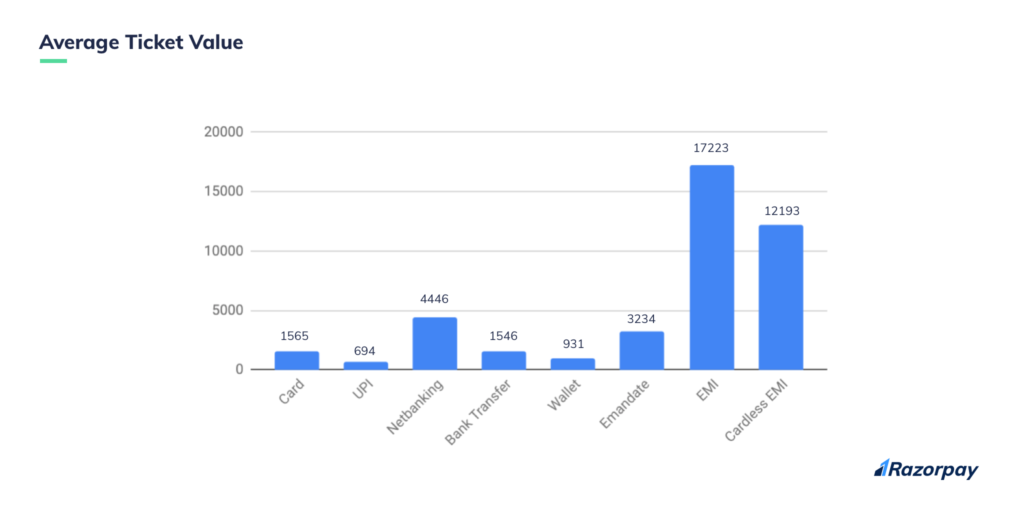
Average Ticket Value (ATV) – consumers still shy away from making large value transactions via UPI
Based on the overall transactions we just discussed, we were able to draw out specific data points concerning the Average Ticket Value of each payment mode that are worth mentioning.
- EMI held the largest ATV, same as April. Consumers preferred EMI over many other payment modes to make big purchases
- Cardless EMI was the second favourite of most consumers as it contributed to the 2nd highest ATV, again, same as April
- Most consumers stuck with the conventional payment modes like EMI, netbanking, and bank transfers to make transactions of higher value
- UPI took the bottom priority for larger faced transactions, but saw a growth in the ATV from 563 in April to 694 this May
Baby steps.
Last time, in our April’s report, we observed a greater number of UPI transactions. But the ATV was a small number since consumers chose other payment modes over UPI for larger transactions. But this time, in the month of May, we observed a larger ATV and fewer UPI transactions from April. Surprised? Don’t be.
EMI and cardless EMI have somewhat become the go-to means of payments for a lot of consumers. This also affects the ATV of UPI. And since the number of UPI transactions reduced, the ATV increased.
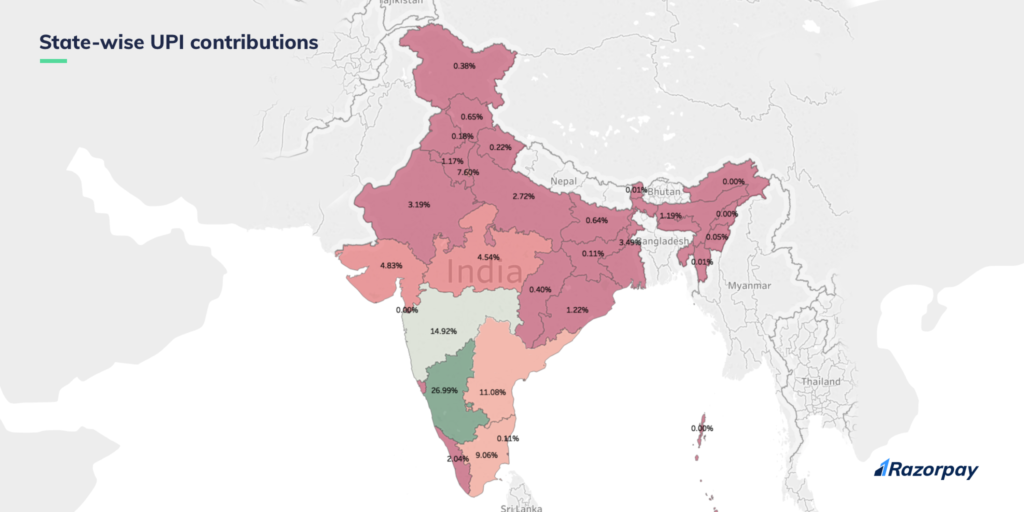
State-wise contribution of UPI transactions
Most of the UPI transactions made by the country came from Karnataka, at 27%, out of which Bangalore contributed close to 37%.
Maharashtra took the second place as it contributed about 15%, out of which, 10% came from Pune.
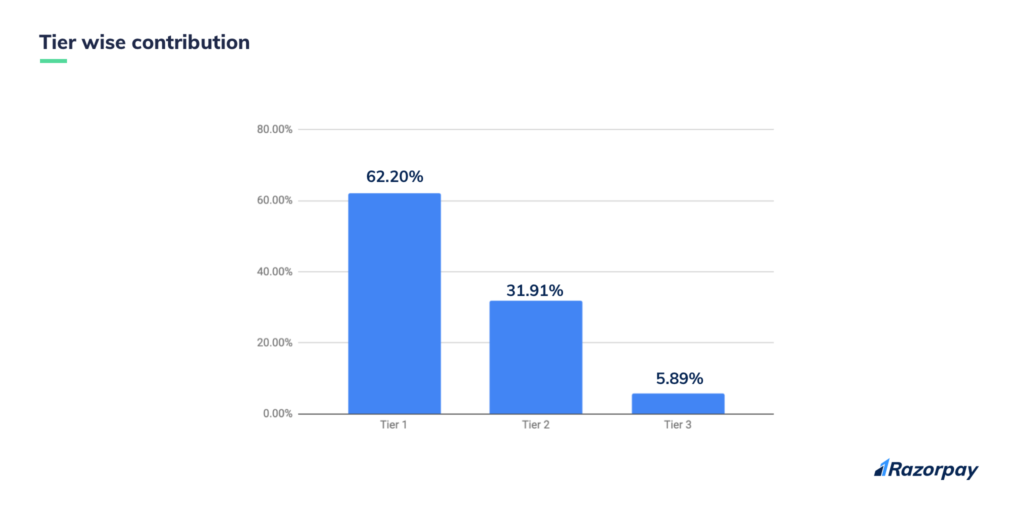
While we’re talking about cities and UPI transactions, here’s a tier-wise split of UPI transactions in May.
The chart clearly depicts the fact that most UPI transactions were made in Tier 1 cities. We spoke about Bangalore’s contribution already (37%). Hyderabad is the next mention after Bangalore, as 12.8% of all UPI transactions came from the city. Chennai contributed 7.66% while Mumbai, 7.45%.
10.35% UPI transactions were made in Pune, while Jaipur and Ahmedabad contributed 3.79% and 3.56% respectively.
The evolution of UPI
In our April’s report, we talked about UPI growing by 20x in a year. That’s quite huge – mainly because UPI changed the landscape of payments in the country.
Although WhatsApp did not come up as much as we thought it would, we’re sure it’ll see a surge in adoption in the upcoming months. Mobile payments will see a significant growth by 2020, by volume.
End of the road
Although May does take a bit of a backseat, it doesn’t necessarily mean that the downward trend will continue in the upcoming months. There’s only one way to find out!
We can’t wait to explore more of Indian fintech with you!
Until next month.
———-
This story was first published on Inc42.

