
UPI has become somewhat of a default payment mode for most people in India. In the last few months, UPI recorded the highest number of transactions, overhauled cards, and other payment modes, and became the most preferred one. If you’re interested to find out what happened in November, hang on tight.
With 800,000 businesses onboard, Razorpay oversees huge volumes of P2M transactions every day from an umpteen number of businesses like BookMyShow, IRCTC, Swiggy, and more. To gather insights, we have only considered P2M transactions of UPI.
Note: All insights in this story are based on transactions held on the Razorpay platform
UPI transactions in the last 6 months
Like we mentioned earlier, UPI has been climbing up bagging the most number of transactions. But in November, UPI saw a slight dip as compared to October, although it was almost on par with September in the number of transactions (saw a growth of 39.56% growth from August to September).

UPI vs other payment modes
Although UPI didn’t see as many transactions, it still remained to be the most favored by Indian consumers.
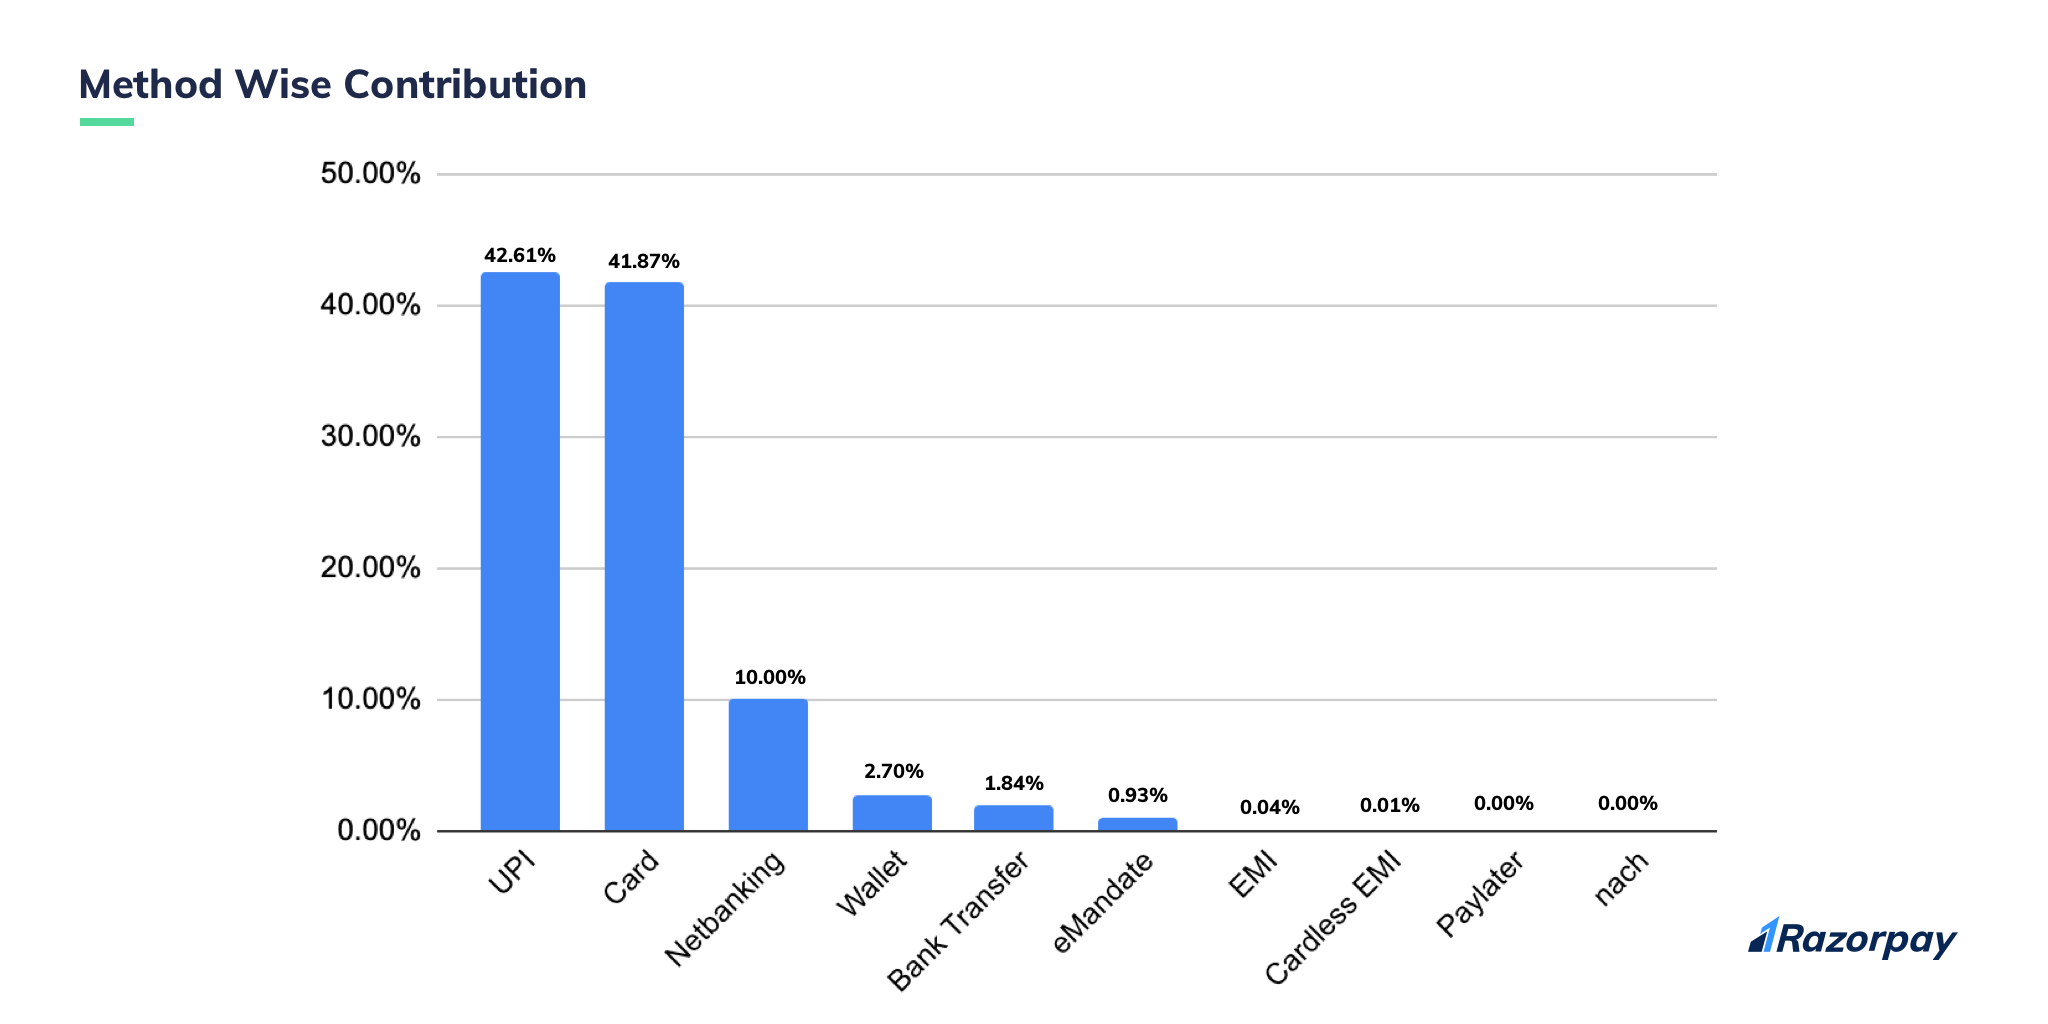
- UPI contributed to 42.61% of the total number of transactions that were carried out on the Razorpay platform
- Cards made a comeback from the previous month by contributing a bigger chunk of payments at 41.87%
- The third most popular payment mode amongst Indian consumers was netbanking, at 10%
UPI app-wise contribution
Since UPI was the preferred payment mode in November, let us understand how some of the UPI apps contributed.
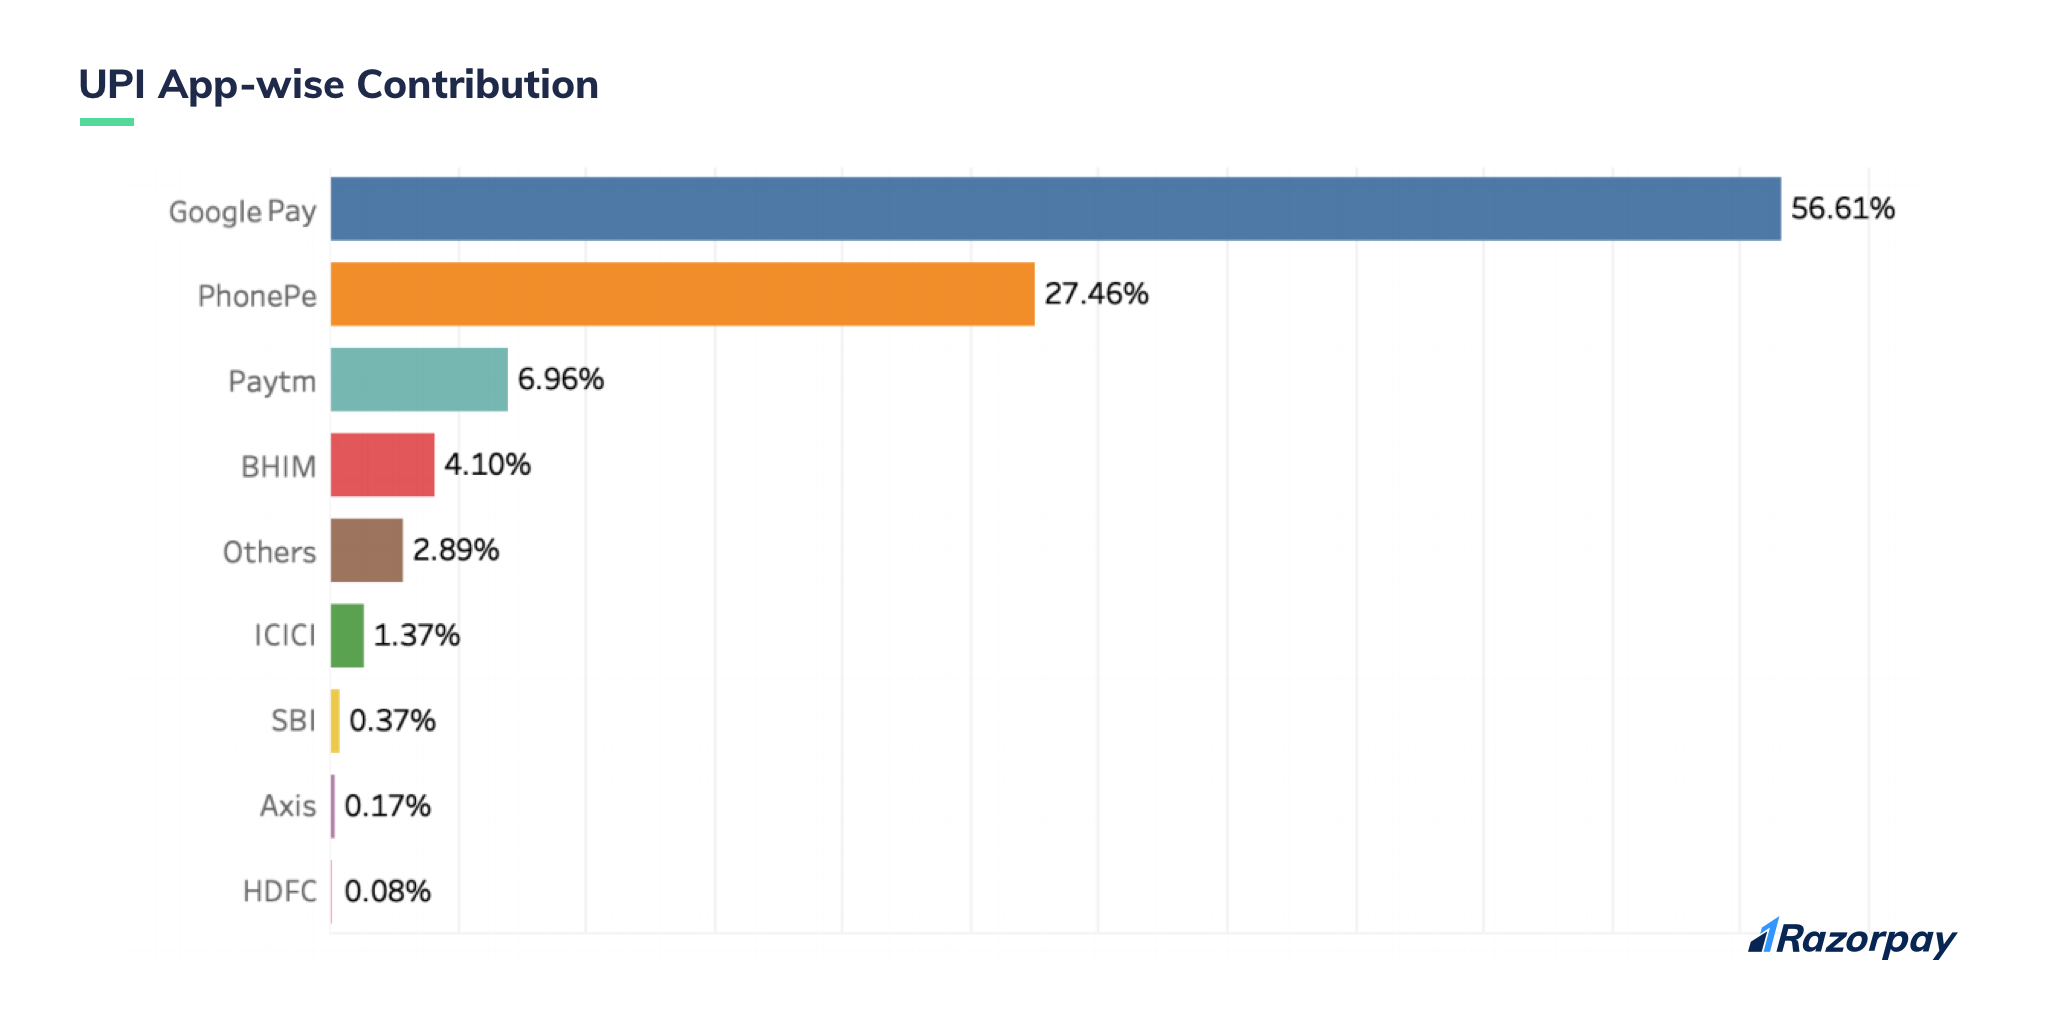
- Again, Google Pay was the number 1 player in the market, contributing to 56.61% of the total UPI transactions
- PhonePe held its position from the previous month by handing out 26.26%
- PayTM was next in line at 6.96%
UPI apps – a closer look
Contributions aside, let us jump in to understand how much our UPI apps grew in November.
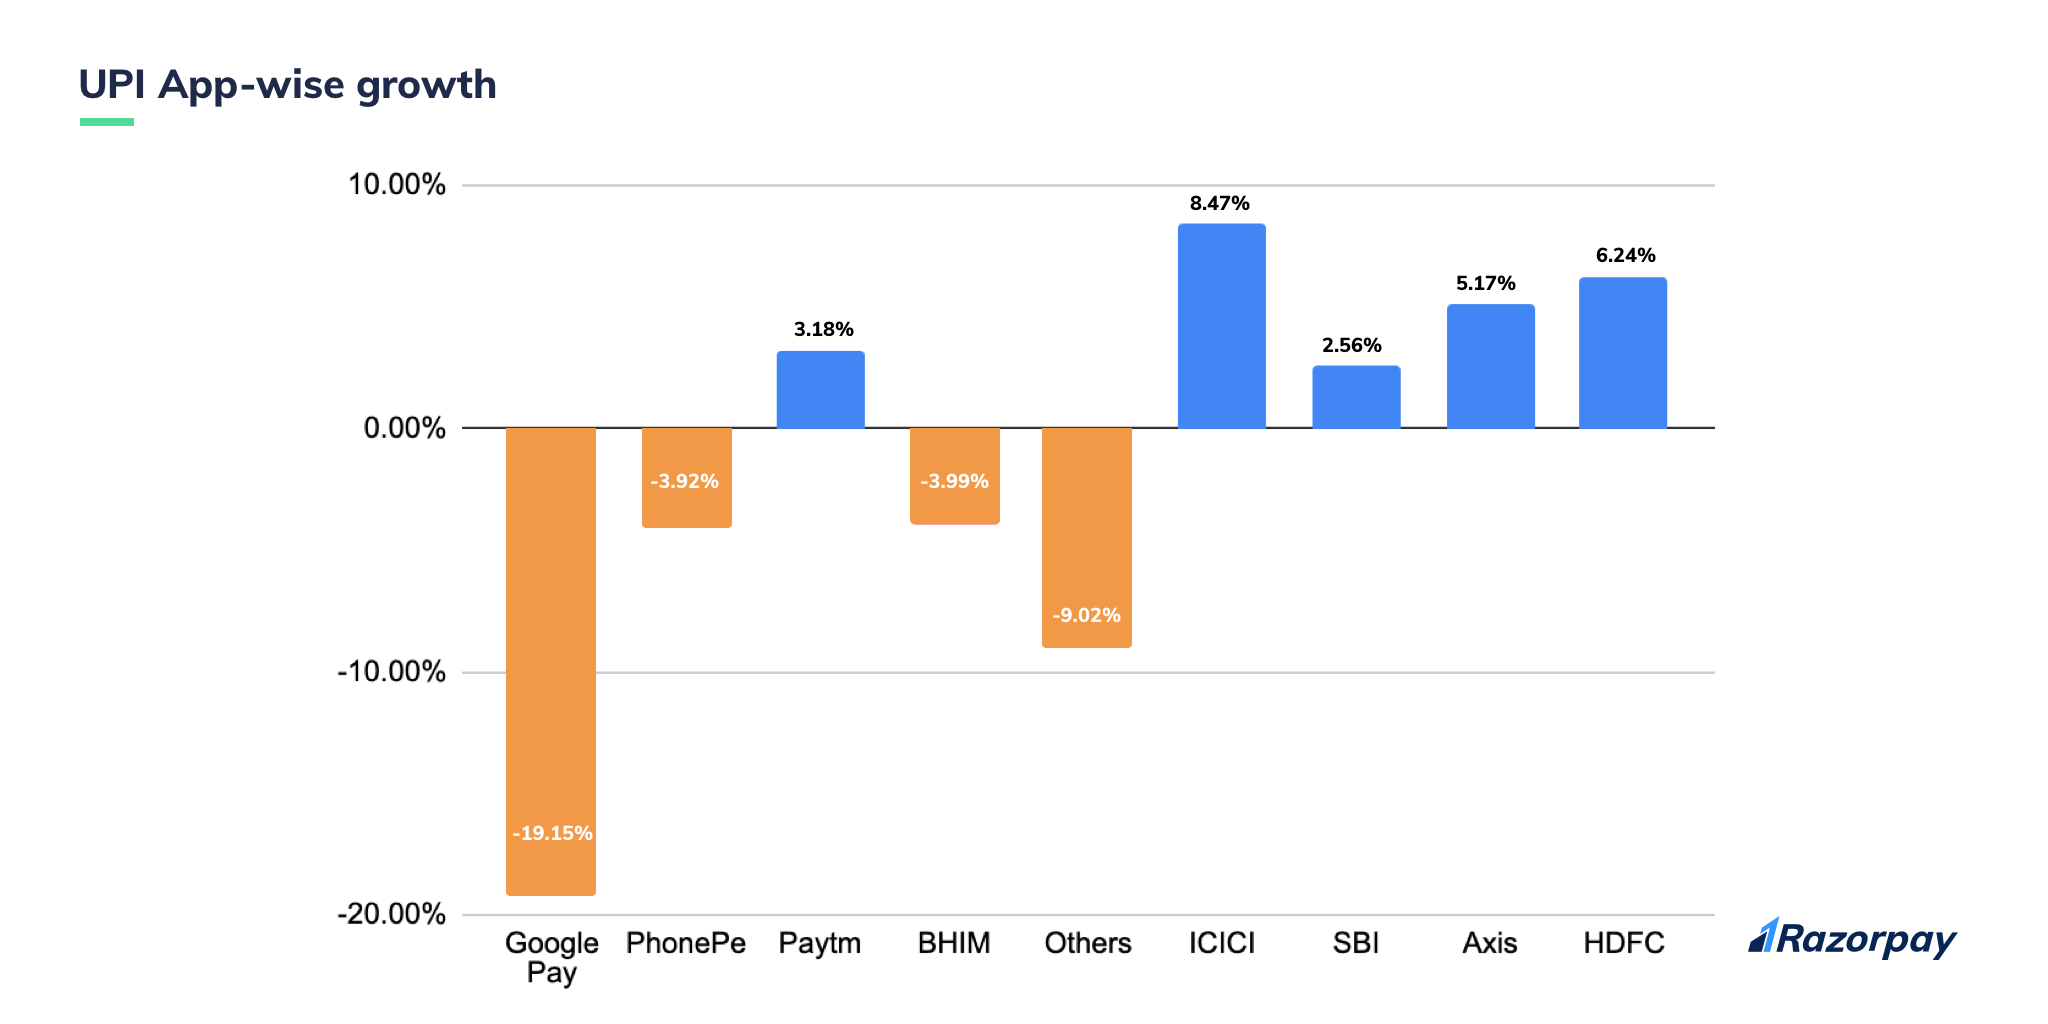
- Unlike before, the ICICI UPI app showed the highest growth in November, at 8.47%, followed by Axis and HDFC UPI apps at 6.24% and 5.17% respectively
- Google Pay although being the most used UPI app, fell by 19.15%
- PhonePe and BHIM also took a downward plunge by 3.92% and 3.99%
UPI transactions – a geographical split
As always, we wanted to see where all the UPI transactions came from. Here’s what we found.
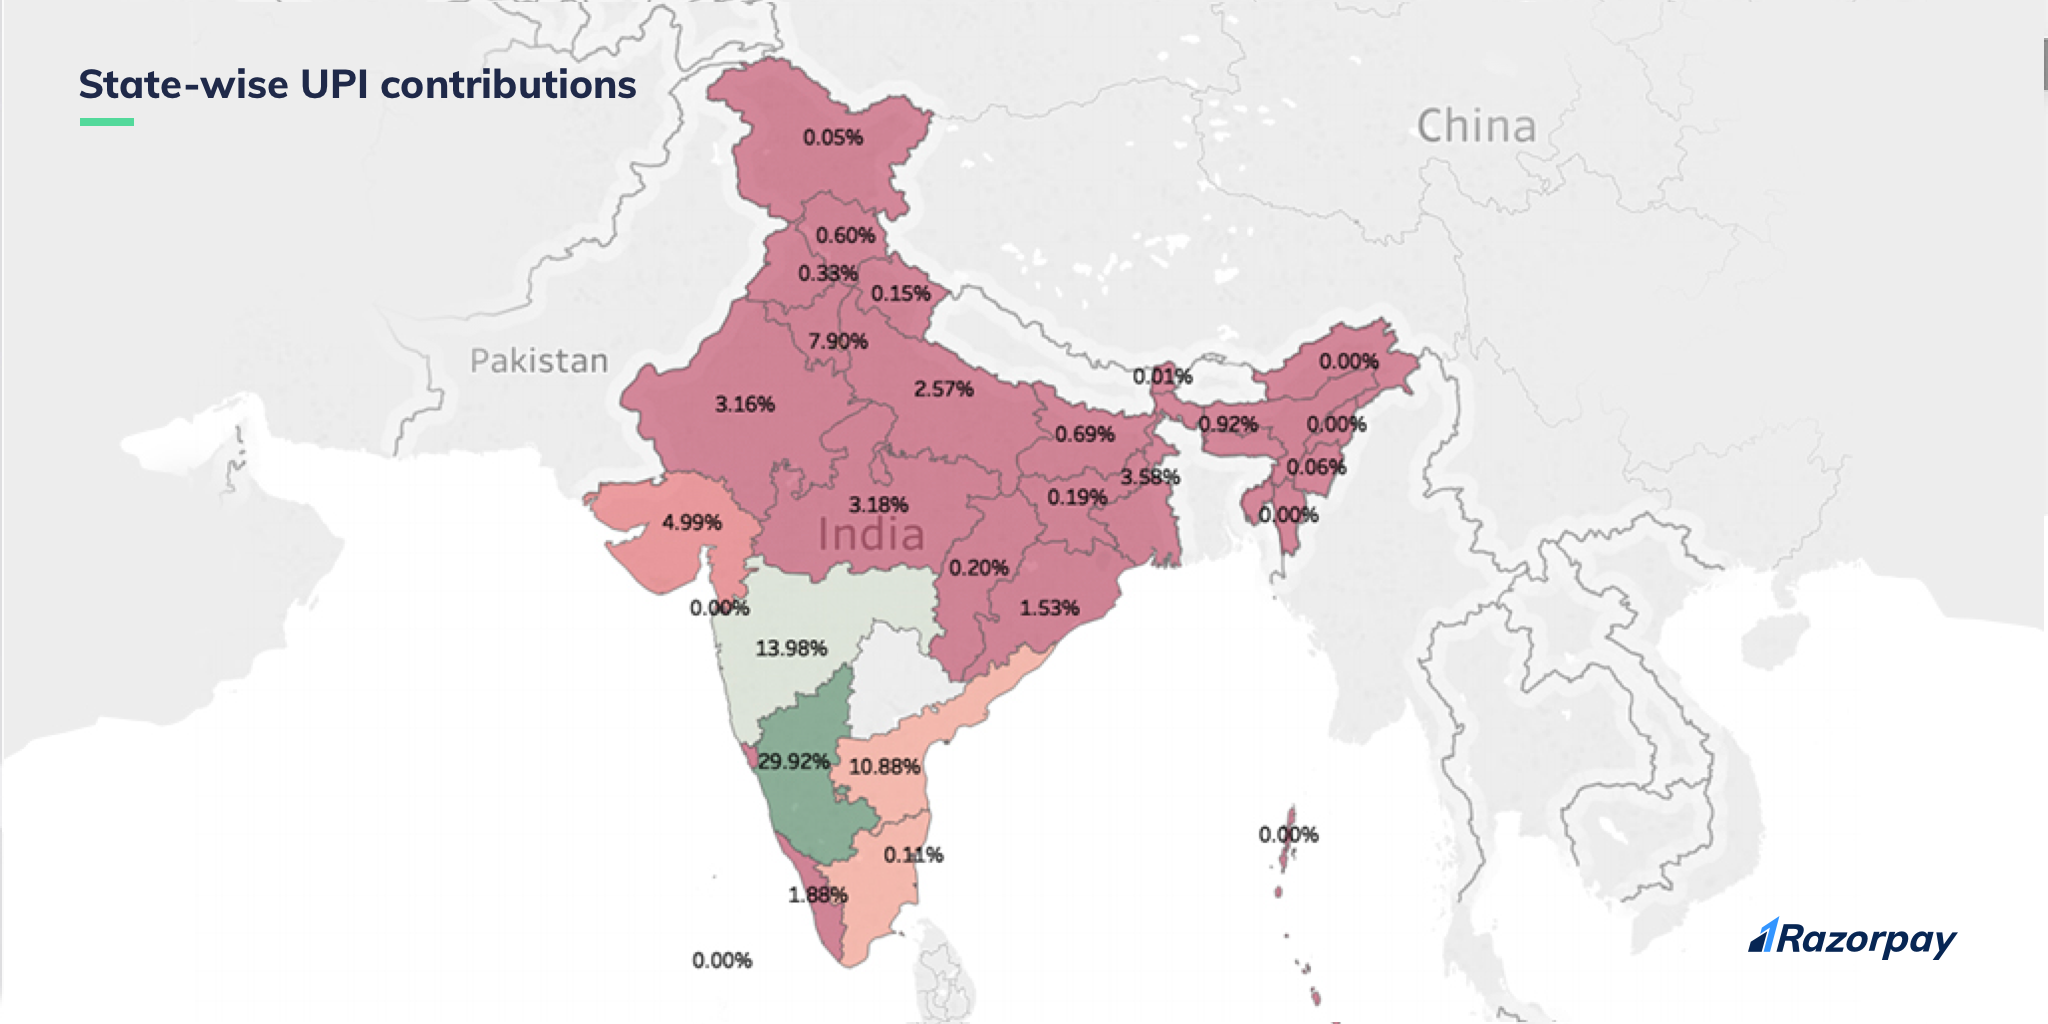
- 29.92% of the total UPI transactions made in November came from Karnataka
- Maharashtra contributed 13.98% while Delhi and NCR pitched in 7.9%
While we are still looking into where UPI transactions, let us take a look at the tier-wise split.
Will UPI make a comeback next month?
UPI has been at the forefront of fintech innovations, pushing a great deal of digital payments in the last few years. The impact UPI has made is huge, reaching so many people from across India and enabling them to make digital payments.
Let’s dive deep next month and draw new insights from the transactions on our platform.
See you then!


