> ## Documentation Index
> Fetch the complete documentation index at: https://razorpay-881012b3.mintlify.site/llms.txt
> Use this file to discover all available pages before exploring further.
# Order Analytics
> Access detailed insights into your order activities with Razorpay Magic Checkout directly from the Razorpay Dashboard.
Available in
🇮🇳 India
Magic Checkout's Order Analytics offers a detailed overview of your business's order activities and performance metrics.
It helps you optimise checkout performance and make data-driven business decisions by tracking:
* **Order Volume Trends**: Monitor total orders and identify peak ordering times for campaign optimisation.
* **Sales Performance**: Track revenue trends, average order values and growth opportunities.
* **Payment Method Distribution**: Analyse prepaid vs COD patterns to reduce RTO risk and optimise payment options.
**Watch Out!**
This feature is available only for Shopify users.
## Get Started
Follow the steps given below to view insights about the various order activities:
1. Log in to the Dashboard.
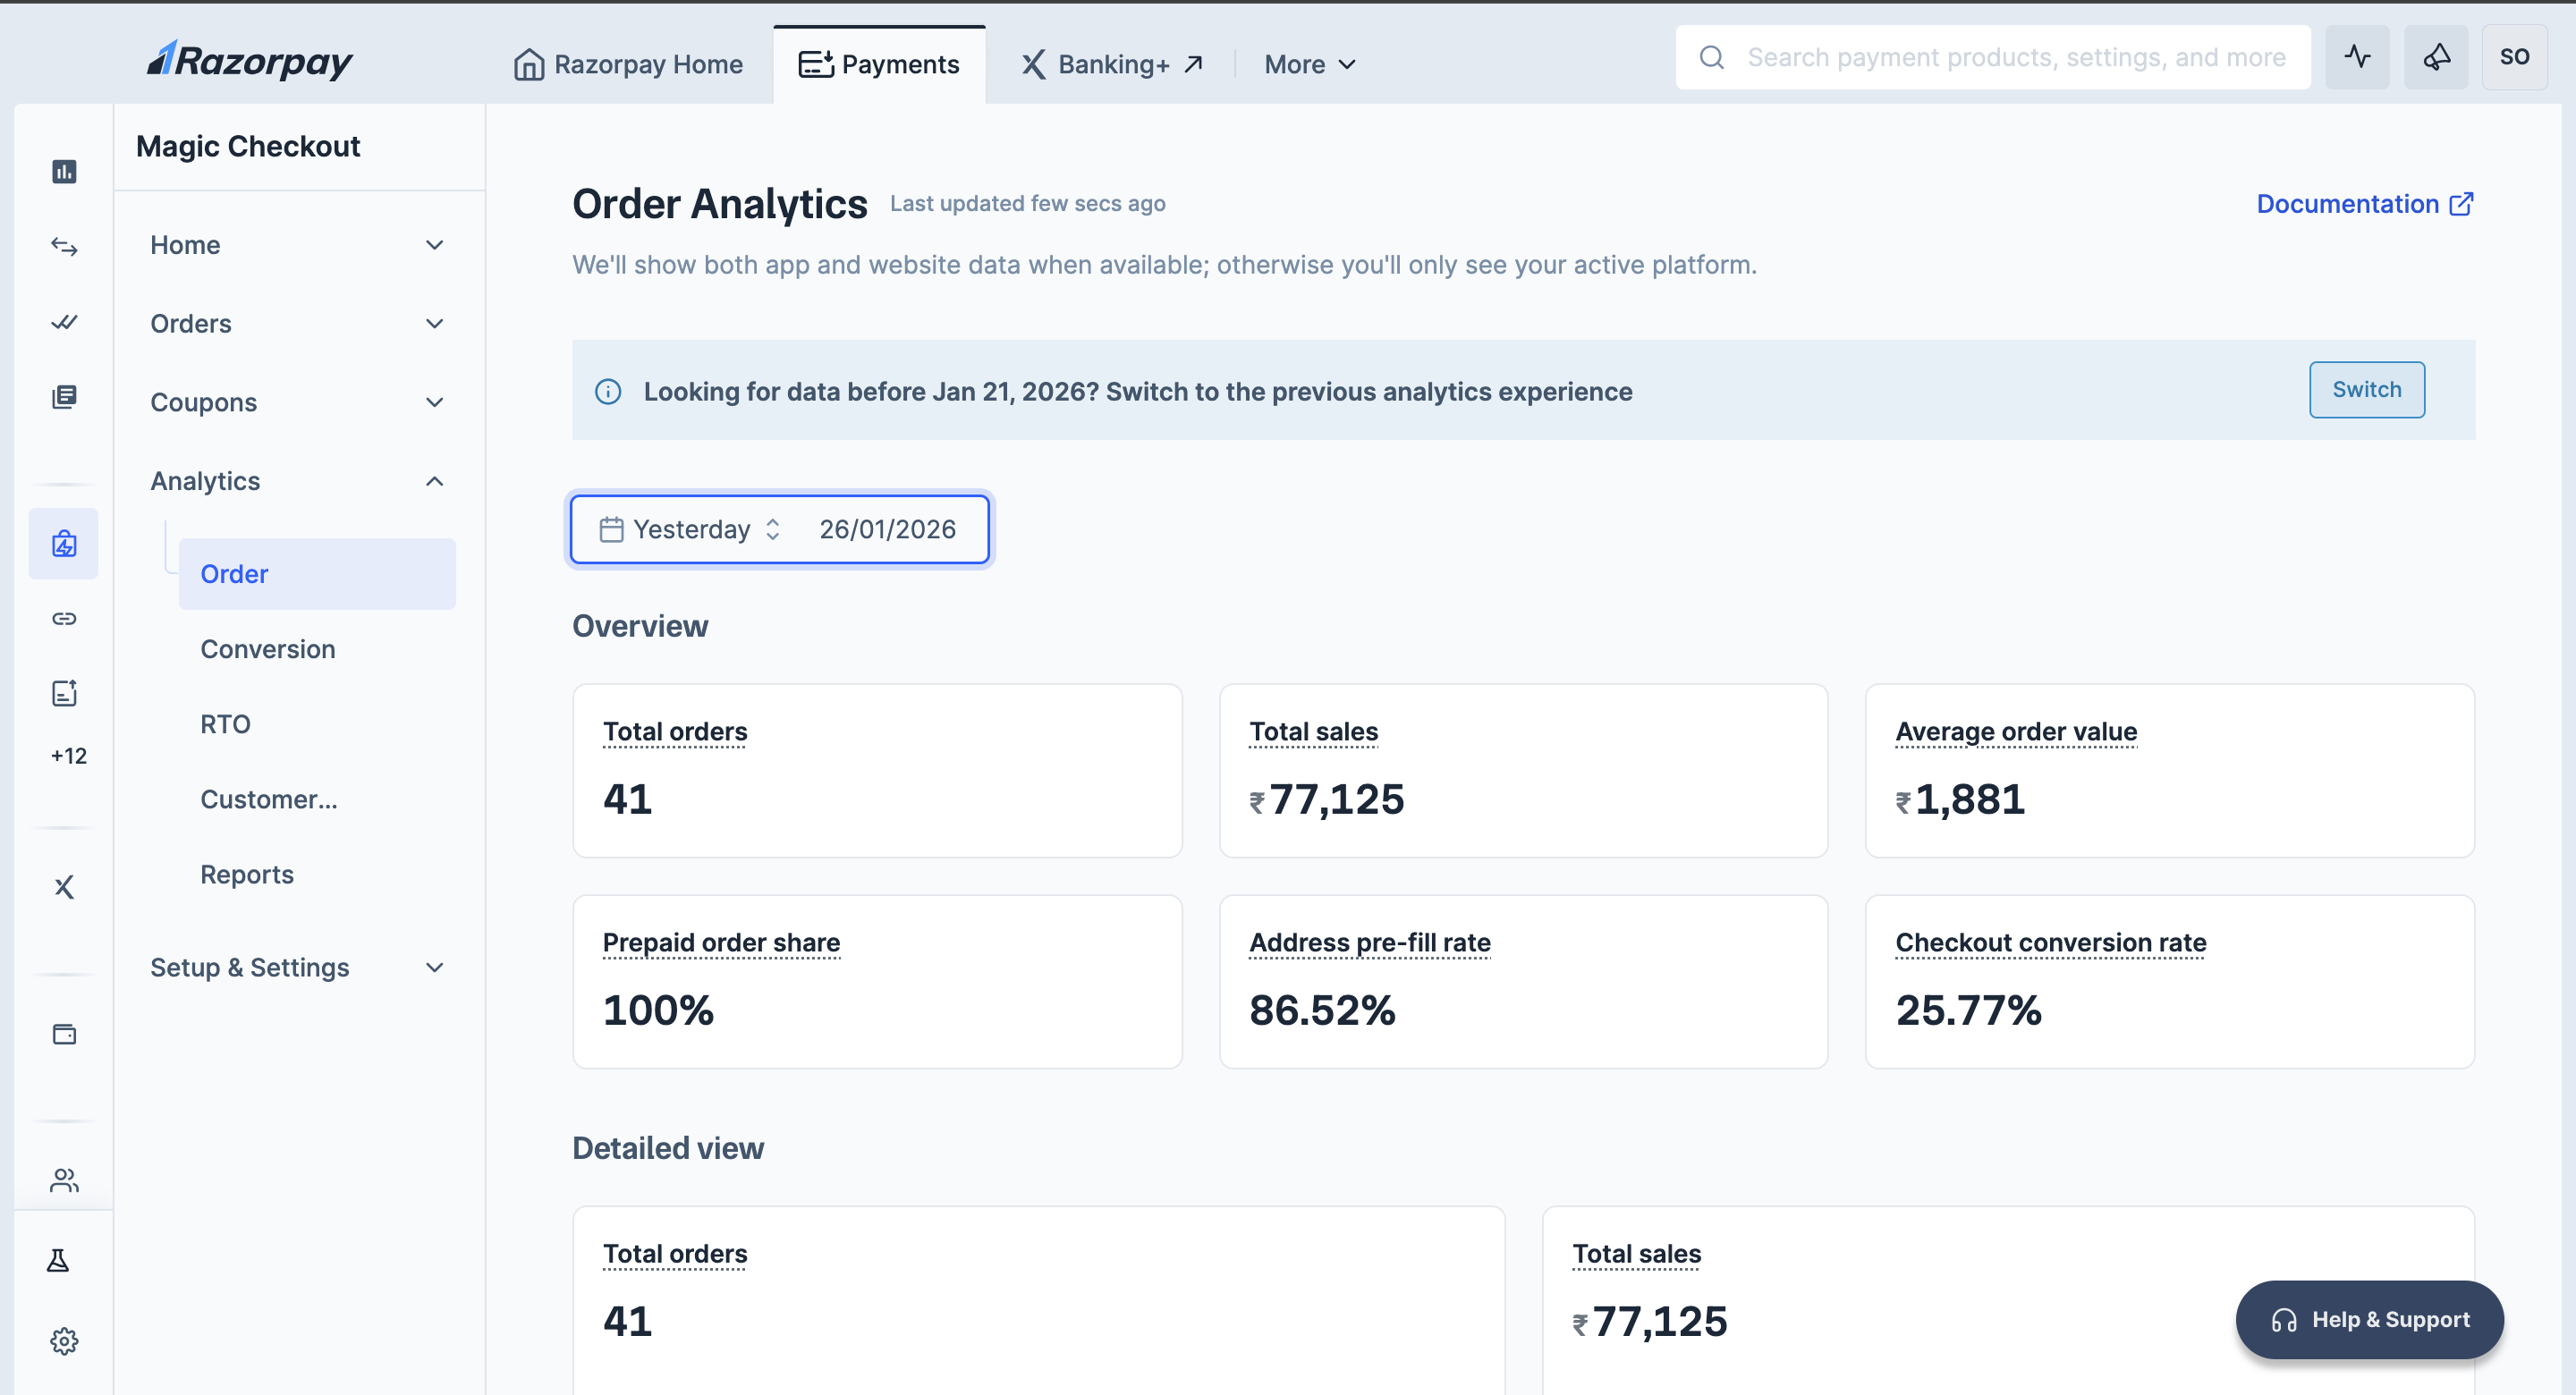
2. Navigate to **Magic Checkout** → **Analytics** and click **Order**.
You can now view the **Order Analytics** on the Dashboard with order performance metrics.
 **Handy Tips**
* Select the date range of your choice to view the data.
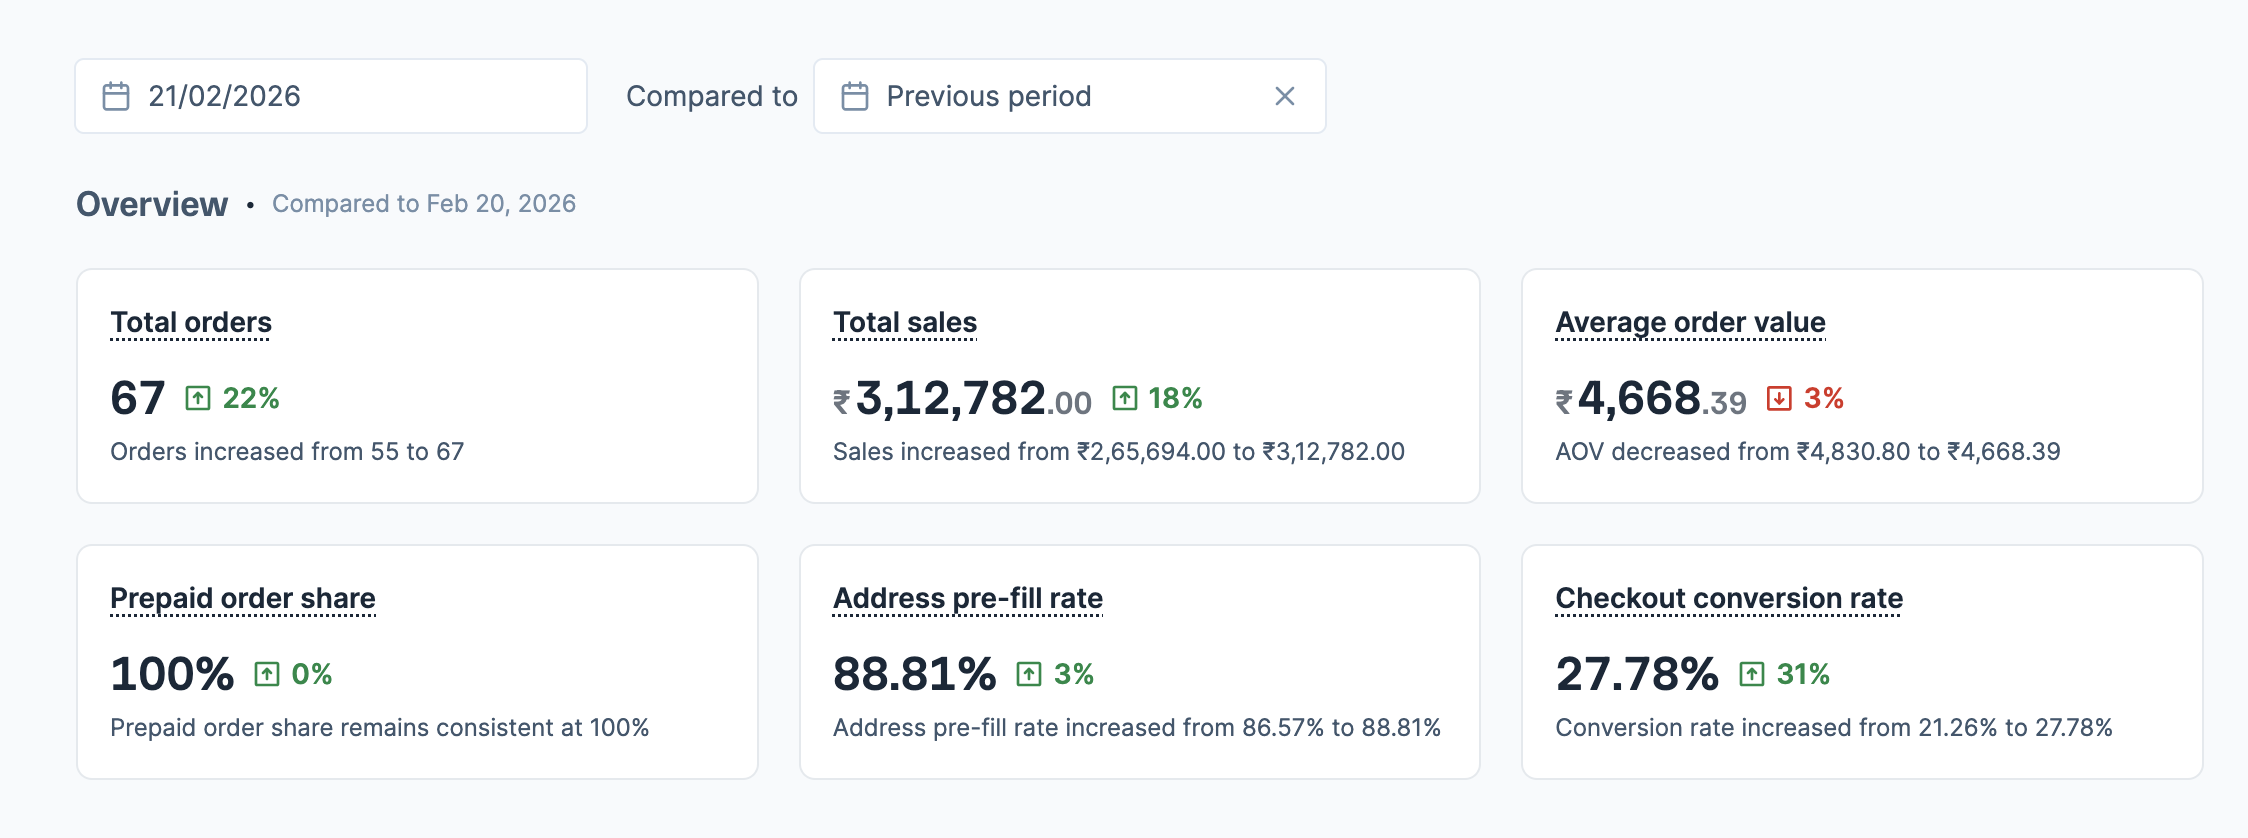
* Use **Compared to** option to compare current data with a previous period or specific date range. Green indicators show improvements, while red indicators show declines.
* Hover over the card headings to understand the calculation methodology.
* Hover alongside the graph lines to view the exact values for specific time periods.
* Download detailed reports with daily data including date, total orders, total sales (in INR), prepaid orders, prepaid sales (in INR), COD orders and COD sales (in INR) for further analysis.
## Compare Data Across Time Periods
You can compare your current data against previous periods to track performance changes:
1. In the **Compared to** field, select the date or time range you want to compare against.
2. View the results with clear indicators:
* **Green arrows** indicate improvements.
* **Red arrows** show declines.
* **Descriptive text** explains the changes. For example: `Orders increased from 55 to 67`.
* **Charts display overlapping lines** for visual comparison between the selected time periods, with date labels at the bottom showing which line represents which period.
**Handy Tips**
* Select the date range of your choice to view the data.
* Use **Compared to** option to compare current data with a previous period or specific date range. Green indicators show improvements, while red indicators show declines.
* Hover over the card headings to understand the calculation methodology.
* Hover alongside the graph lines to view the exact values for specific time periods.
* Download detailed reports with daily data including date, total orders, total sales (in INR), prepaid orders, prepaid sales (in INR), COD orders and COD sales (in INR) for further analysis.
## Compare Data Across Time Periods
You can compare your current data against previous periods to track performance changes:
1. In the **Compared to** field, select the date or time range you want to compare against.
2. View the results with clear indicators:
* **Green arrows** indicate improvements.
* **Red arrows** show declines.
* **Descriptive text** explains the changes. For example: `Orders increased from 55 to 67`.
* **Charts display overlapping lines** for visual comparison between the selected time periods, with date labels at the bottom showing which line represents which period.
 ## Order Metrics
The Order Analytics Dashboard displays the following metrics to track your Magic Checkout order performance:
| Field | Description | Calculation |
| ------------------------ | ---------------------------------------------------------------------------- | ------------------------------------------------------------------------------------------------------ |
| Total orders | Total number of Magic Checkout orders placed. | Count of orders placed. |
| Total sales | Total sales amount from Magic Checkout order. | Sum of net sales, additional fees, duties, shipping and taxes. |
| Average order value | Average value of Magic Checkout orders. | Total sales divided by total orders. |
| Prepaid order share | Percentage of orders paid via prepaid methods. | Total prepaid orders divided by total orders. |
| Address pre-fill rate | Percentage of logged-in users who see their addresses prefilled at checkout. | Number of logged-in users with pre-filled addresses divided by number of logged in users. |
| Checkout conversion rate | Percentage of checkout sessions that resulted in an order. | Total sessions (minimum one successful Magic Checkout order) divided by total Magic Checkout sessions. |
**Watch Out!**
**Address pre-fill rate** includes both users who were already logged in when they arrived at checkout and users who log in during the checkout process, provided they have saved addresses available.
## Detailed View
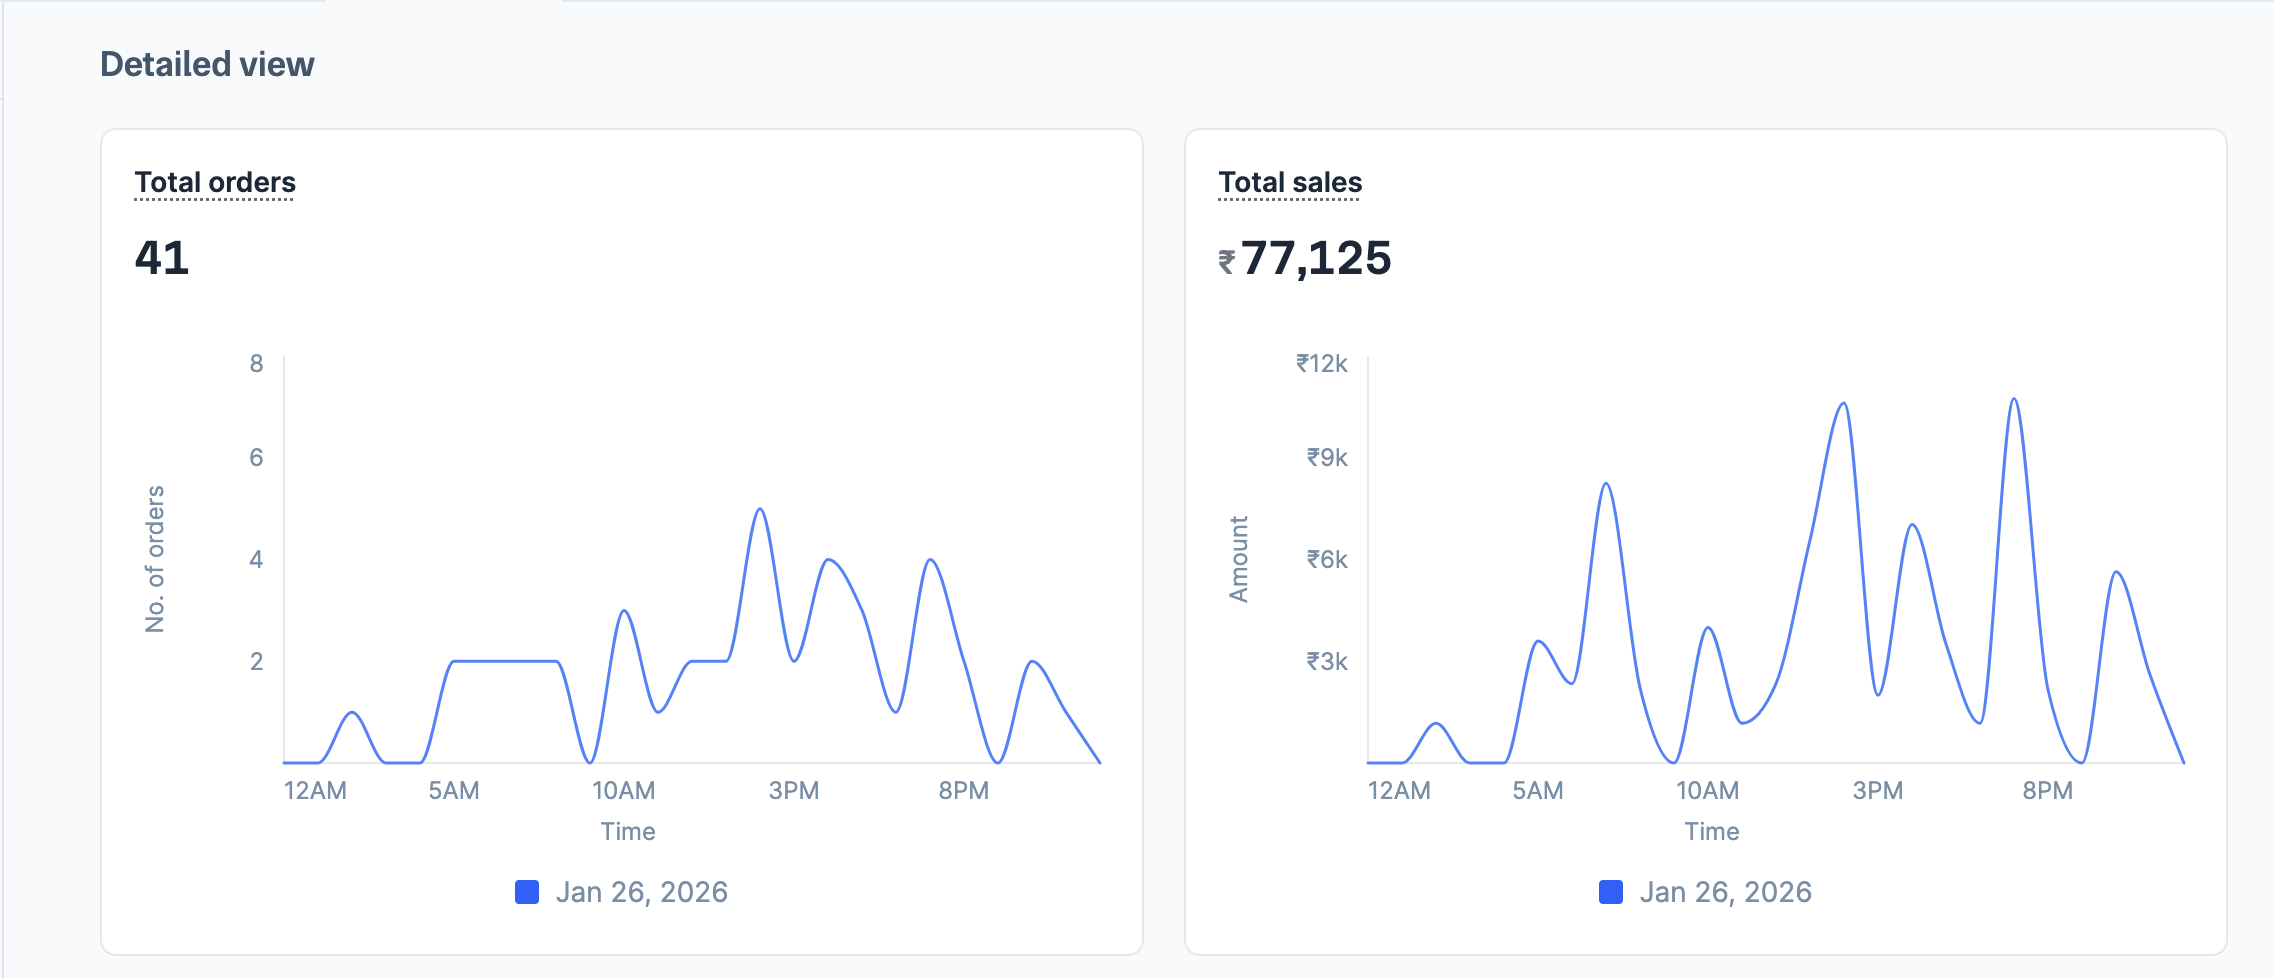
The **Detailed view** section displays charts that allow you to analyse trends and patterns in your order data:
* **Total orders**: Line chart tracking total order volume trends throughout the selected time period.
* **Total sales**: Line chart showing total sales revenue patterns.
## Order Metrics
The Order Analytics Dashboard displays the following metrics to track your Magic Checkout order performance:
| Field | Description | Calculation |
| ------------------------ | ---------------------------------------------------------------------------- | ------------------------------------------------------------------------------------------------------ |
| Total orders | Total number of Magic Checkout orders placed. | Count of orders placed. |
| Total sales | Total sales amount from Magic Checkout order. | Sum of net sales, additional fees, duties, shipping and taxes. |
| Average order value | Average value of Magic Checkout orders. | Total sales divided by total orders. |
| Prepaid order share | Percentage of orders paid via prepaid methods. | Total prepaid orders divided by total orders. |
| Address pre-fill rate | Percentage of logged-in users who see their addresses prefilled at checkout. | Number of logged-in users with pre-filled addresses divided by number of logged in users. |
| Checkout conversion rate | Percentage of checkout sessions that resulted in an order. | Total sessions (minimum one successful Magic Checkout order) divided by total Magic Checkout sessions. |
**Watch Out!**
**Address pre-fill rate** includes both users who were already logged in when they arrived at checkout and users who log in during the checkout process, provided they have saved addresses available.
## Detailed View
The **Detailed view** section displays charts that allow you to analyse trends and patterns in your order data:
* **Total orders**: Line chart tracking total order volume trends throughout the selected time period.
* **Total sales**: Line chart showing total sales revenue patterns.
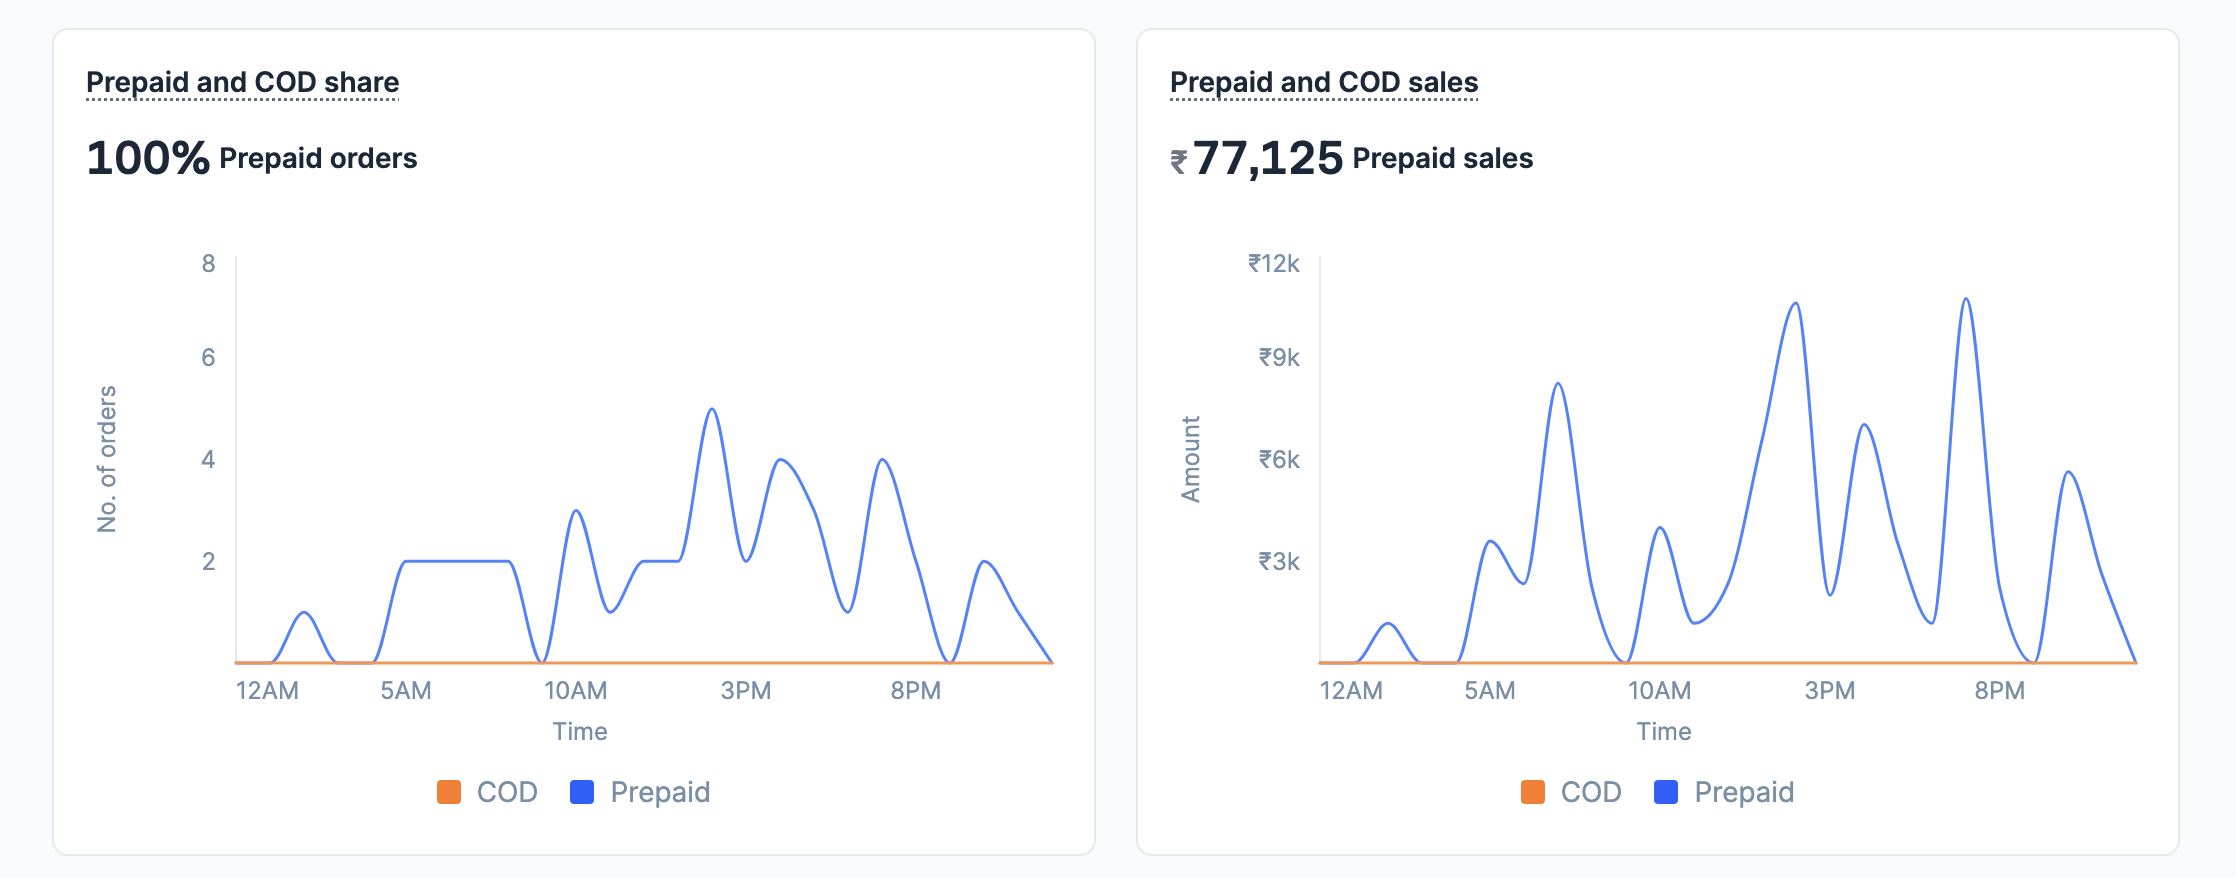
 * **Prepaid and COD share**: Comparative chart showing the distribution between prepaid and COD orders over time.
* **Prepaid and COD sales**: Comparative chart showing revenue distribution between prepaid and COD sales over time.
* **Prepaid and COD share**: Comparative chart showing the distribution between prepaid and COD orders over time.
* **Prepaid and COD sales**: Comparative chart showing revenue distribution between prepaid and COD sales over time.
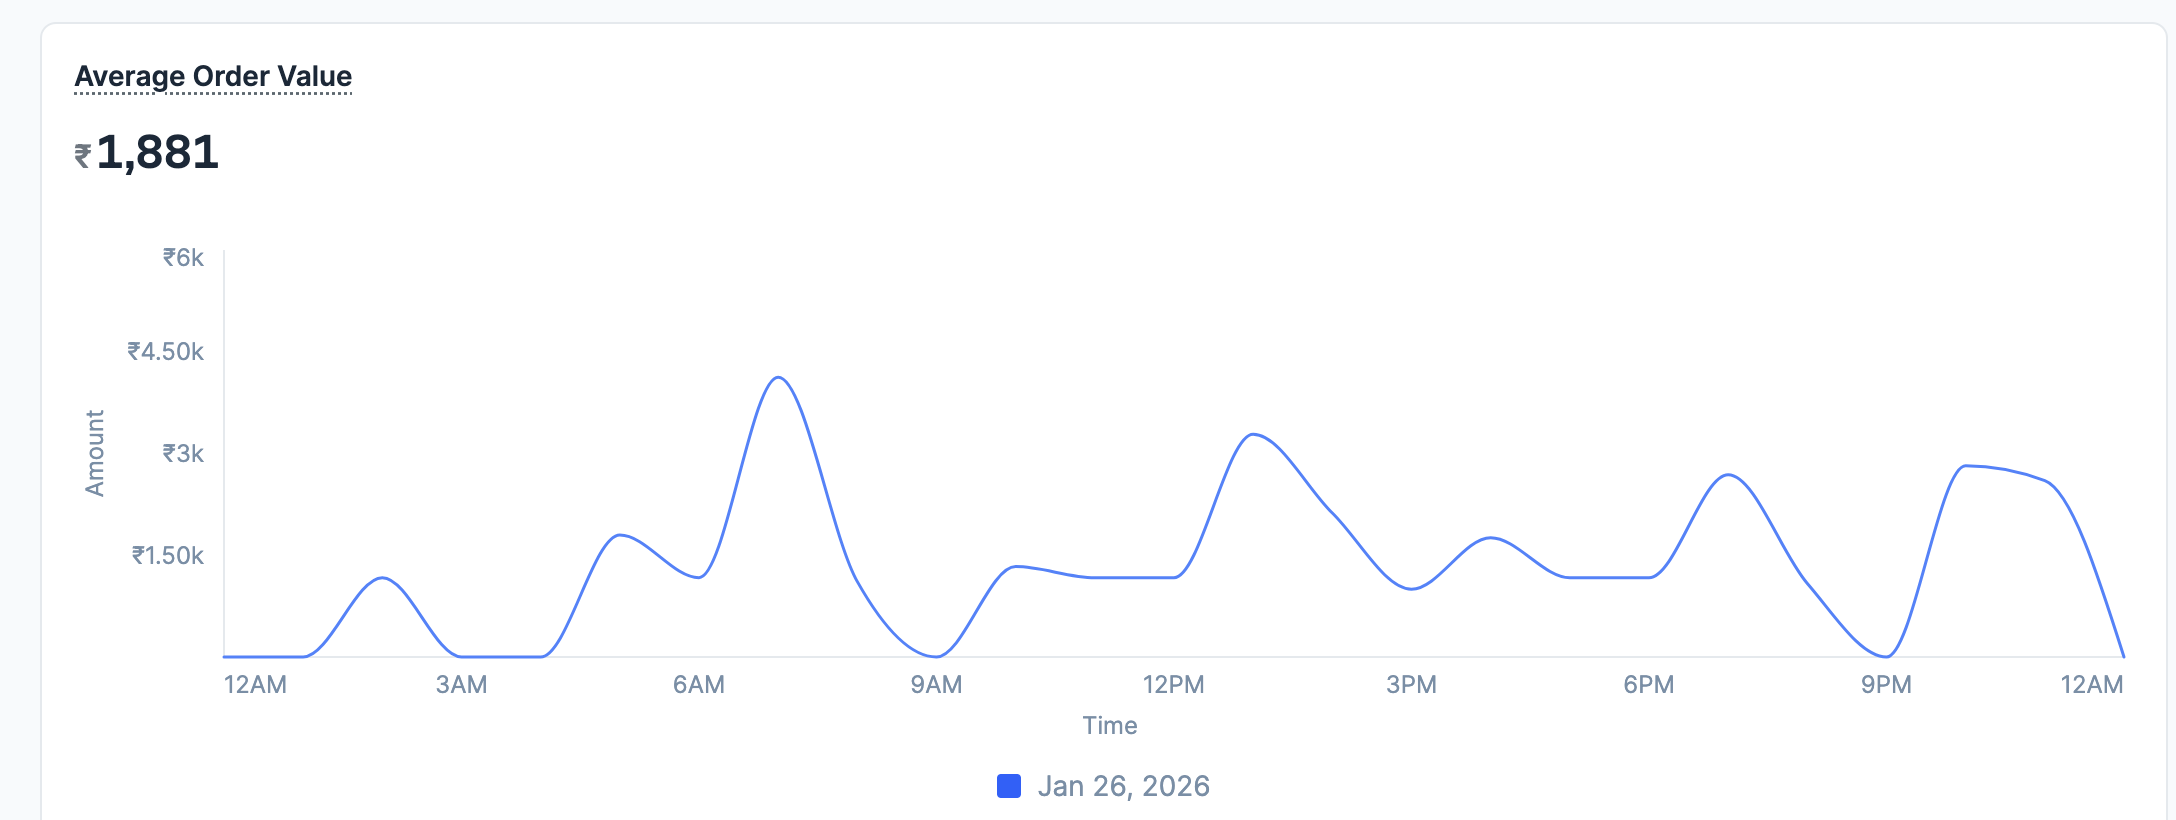
 * **Average Order Value**: Line chart displaying AOV fluctuations with hover tooltips showing specific values at different times.