
The pandemic, its consequences and the state of Indian e-commerce industry
E-commerce in India is expected to grow to US$ 111.40 billion by 2025 from US$ 46.2 billion as of 2020. Much of this is attributed to the rise in Internet and smartphone penetration.
But, 2020 has not been just any year. It has opened doors to opportunities for some and put the rest through trying times. However, e-commerce was among the few sectors which emerged as a clear backbone of the lockdown period.
Highlights of the e-commerce market in 2021
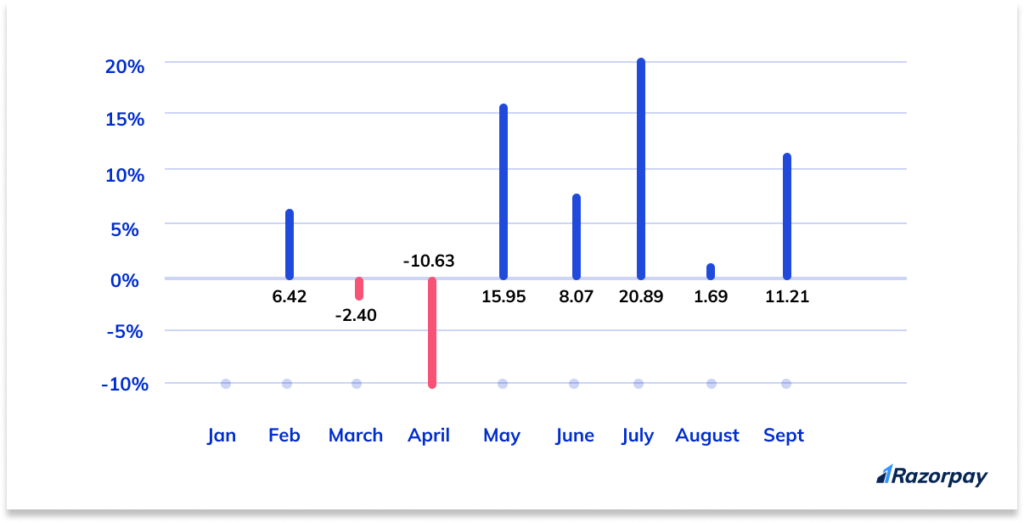
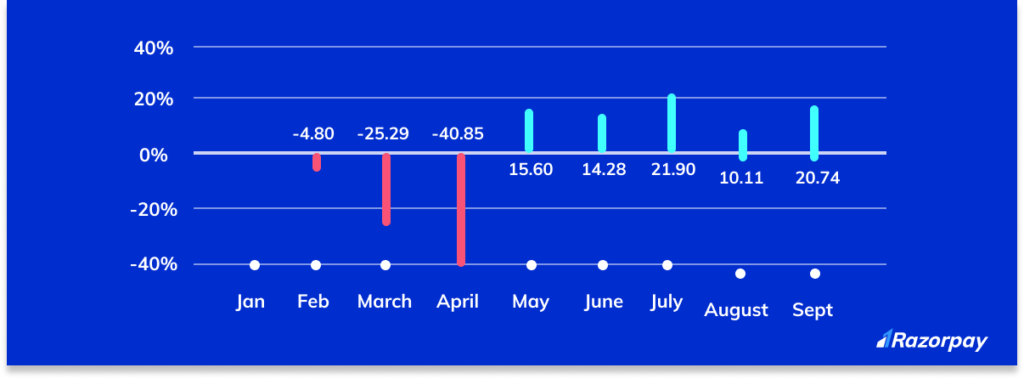
E-commerce in a nutshell – Orders placed
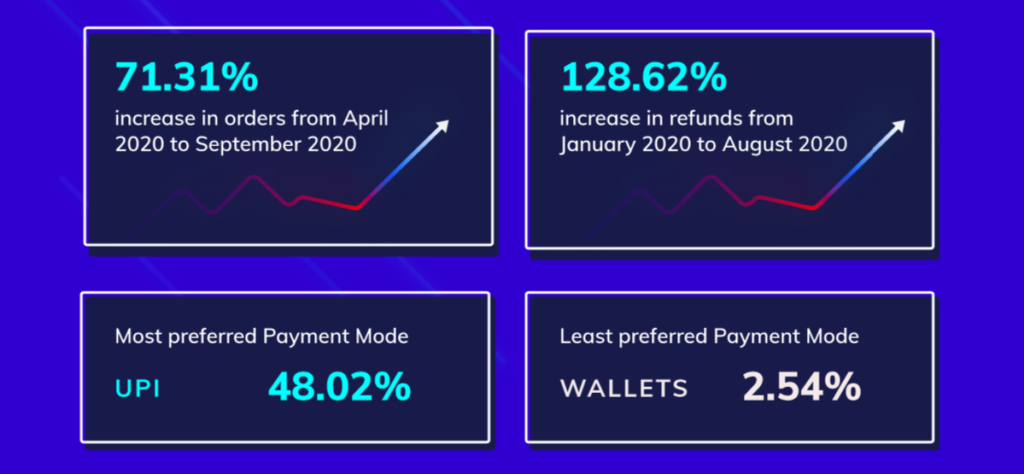
The lockdown was enforced in the last week of March. Just in a week’s time, e-commerce sites saw a dip of 2.40% in the orders placed. The highest dip in the entire year was seen in the month of April, by approximately 10% while the highest spike was observed in July.
It is noteworthy that after April, there has been a constant rise in the number of orders placed.
How often have Indians shopped online
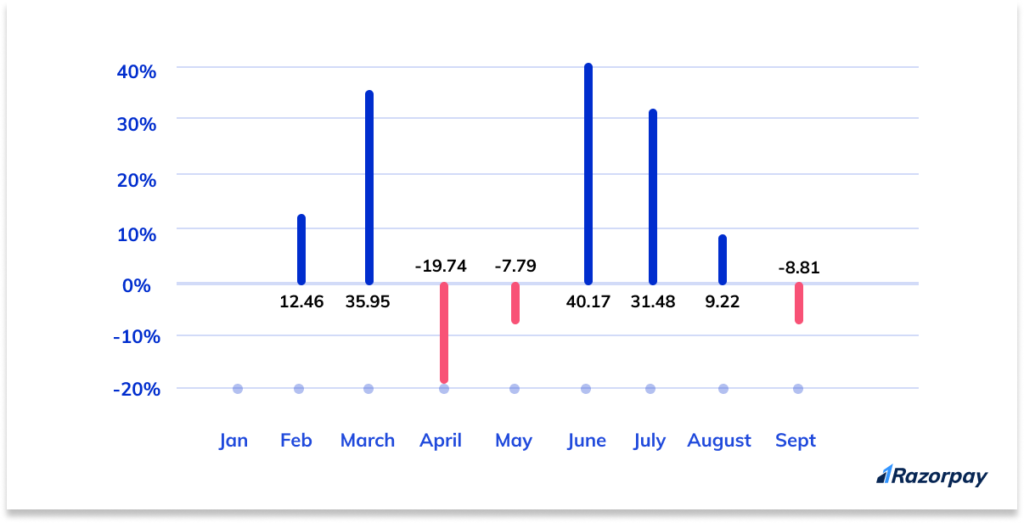
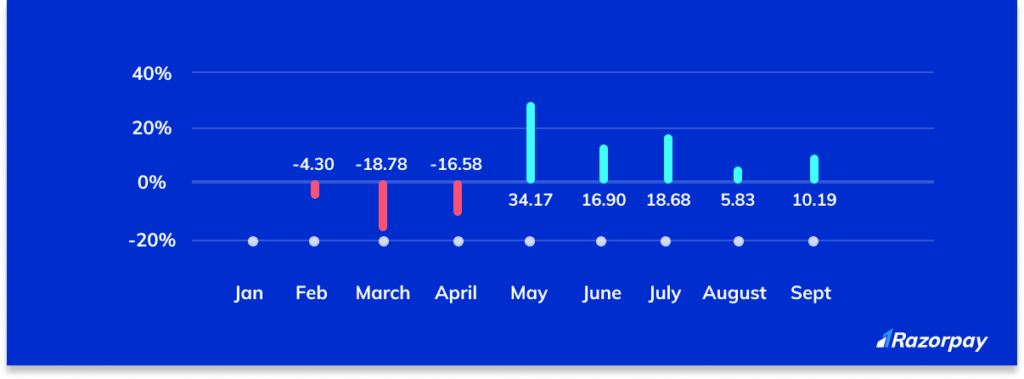
E-commerce in a nutshell – Refunds initiated
#2021SoFar
It is assumed that the higher the number of orders an e-commerce site receives, the higher the refund count. Well, in our findings we observed a pinch of this assumption. February, April, and May were calm months for the chargeback teams as the number of refunds initiated is comparatively less than the rest of the months.
The pandemic forced (or empowered) hundreds of people to make their first online purchase. We assume that the RTO rates have seen a spike due to a lack of experience in online shopping.
How often have Indians requested a refund
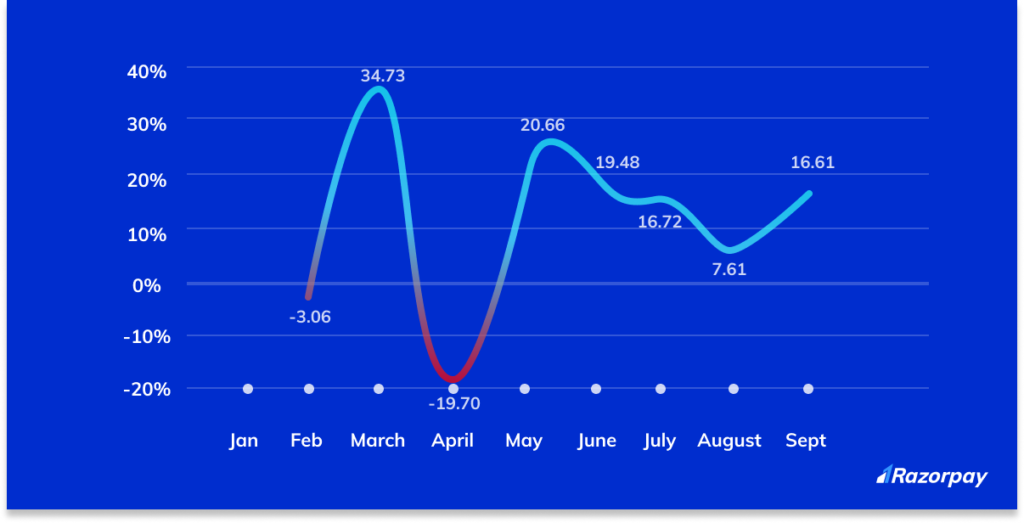
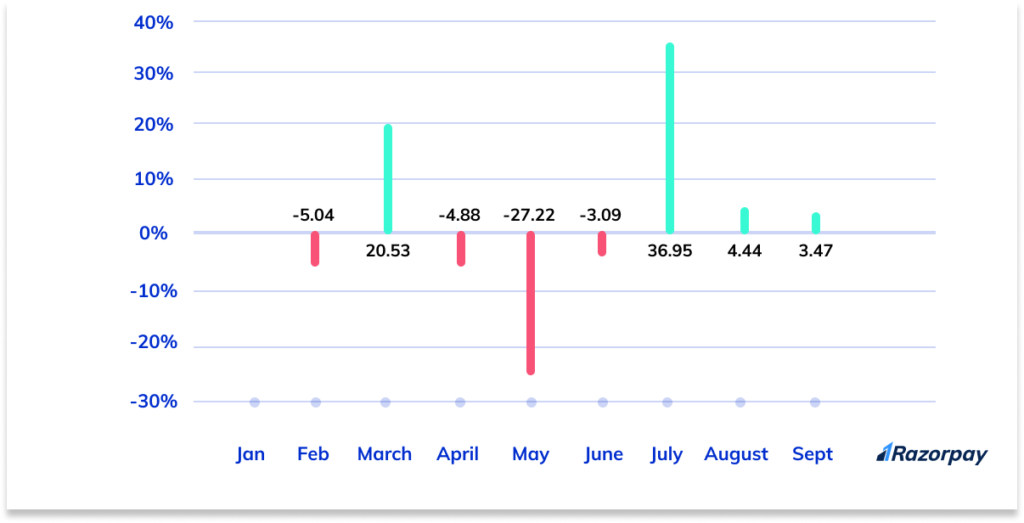
E-commerce in a nutshell – GMV overview
#2021SoFar
The Indian e-commerce market witnessed the largest GMV dip in February, surprisingly. Recently September came in like a cool breeze for the entire market crossing the 2000 Cr GMV mark. It is not wrong saying that the months of strict lockdown (March-May) saw a dip, but not a massive one and it did not take long for businesses to get back to those higher revenue days.
How much has India spent on online commerce
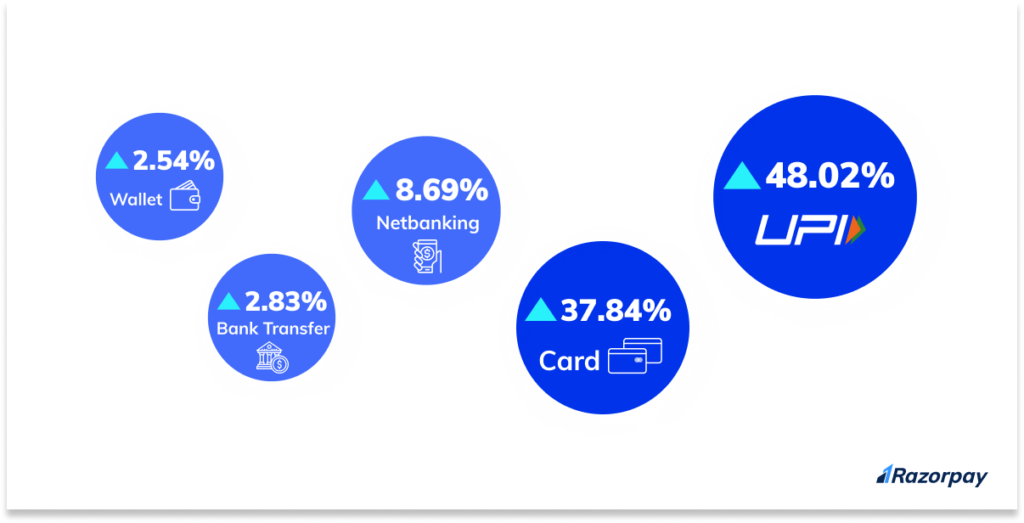
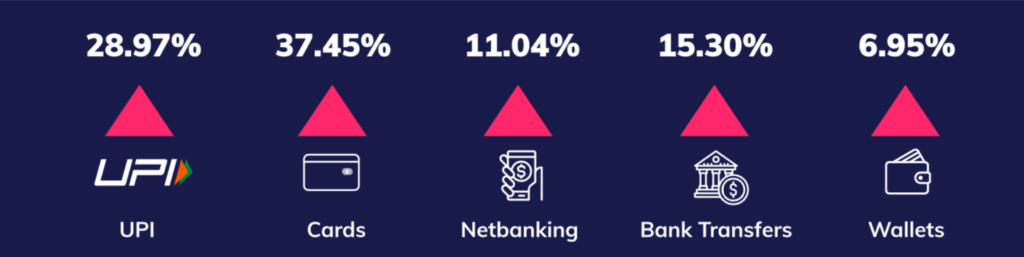
E-commerce in a nutshell – Payment modes preferred
#2021SoFar
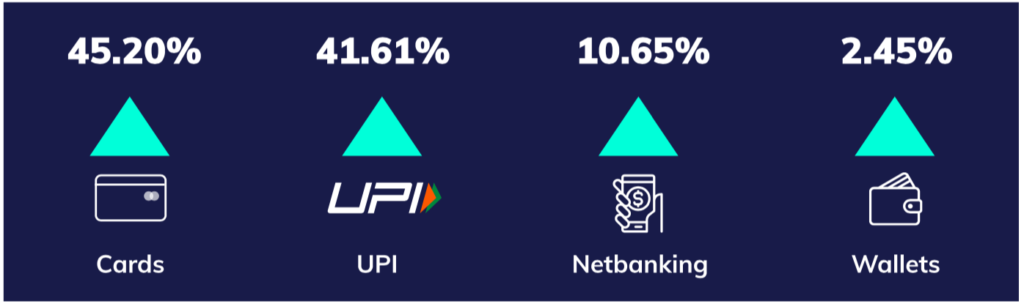
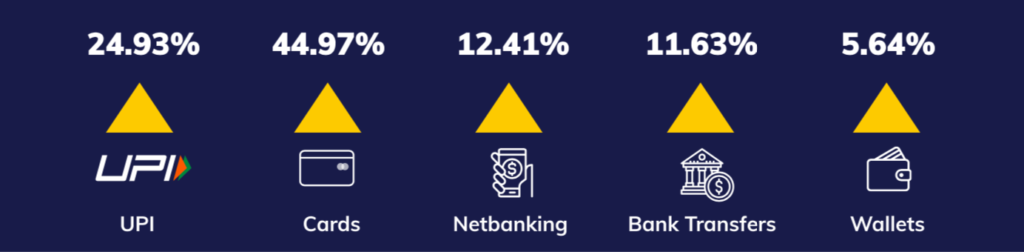
Clearly, UPI has become everyone’s favourite mode of transaction soon after it’s advent. Almost half of the transactions in the entire e-commerce market are UPI-based. Second in the race are credit and debit cards.
It isn’t too surprising to see net banking contributing only around 8% to the overall transactions. The remaining chunk of the orders is paid via bank transfers, wallets, PayLater options, and so on.
How Indians prefer to pay for their orders
What we noticed in the world of beauty & personal care
#2021SoFar
How are Indians placing orders for beauty & personal care products?
How much did India spend on hygiene & beauty
How often did Indians ask for a refund in beauty & personal care industry
What mode of payments is most used by beauty & personal care shoppers
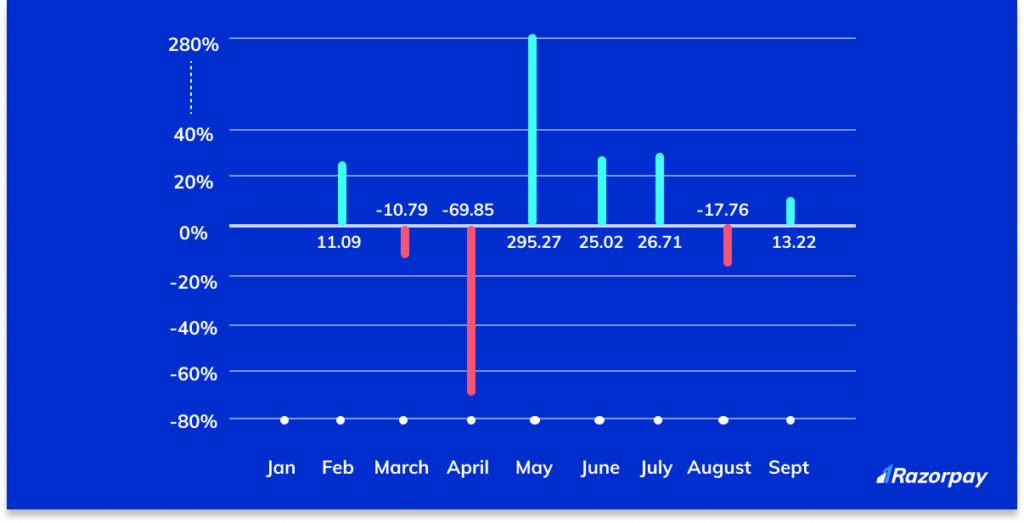
Key highlights – Beauty & personal care
- Orders placed: The months post the lockdown (March and April), saw a sharp decline of 69.85%. The month after Unlock 1.0, that is May, saw an increase of almost 295% in the transactions.
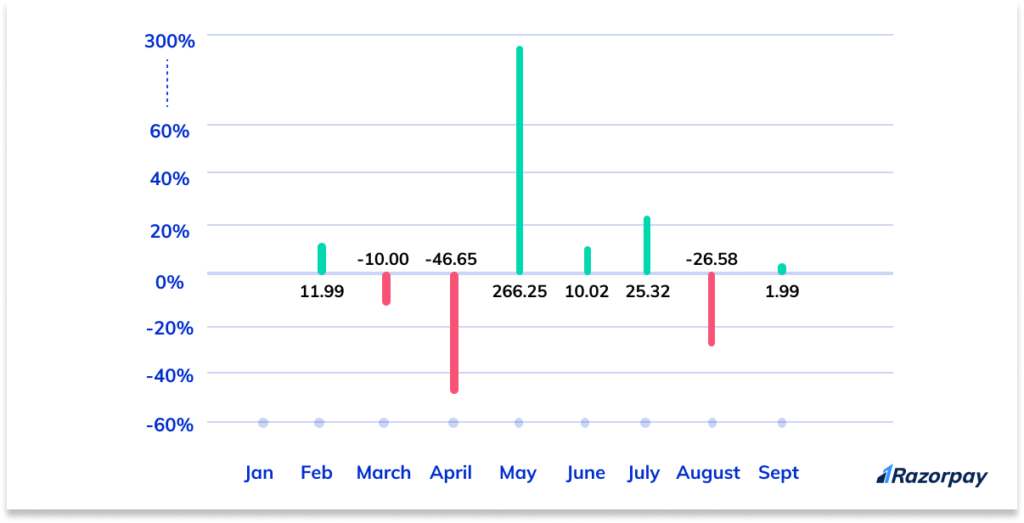
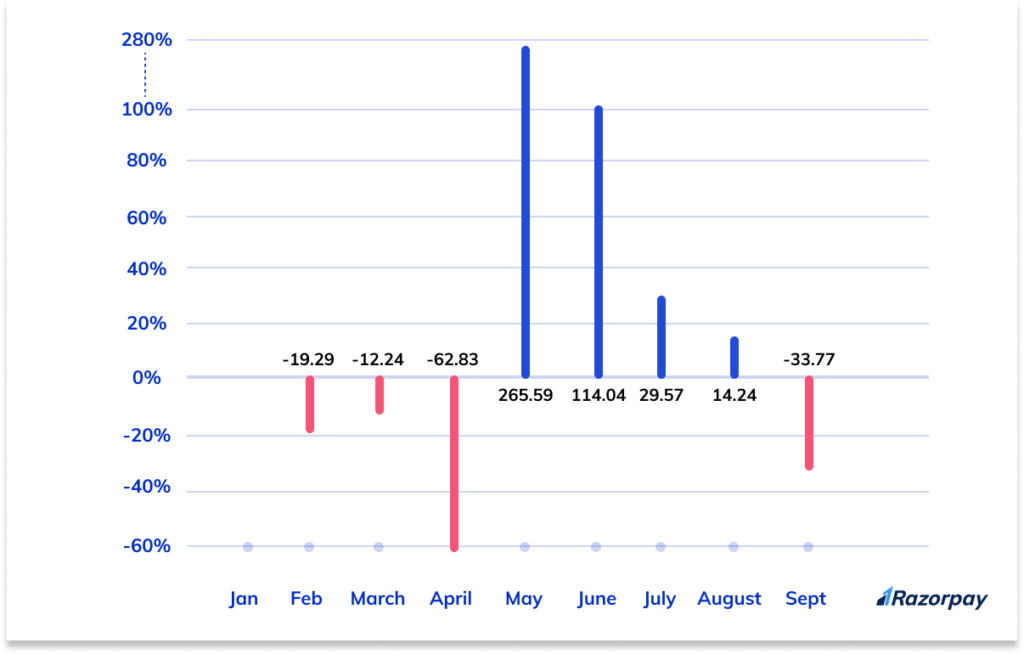
- GMV trends: The post lockdown months saw a dip in GMV by 46%. On the other hand, soon after the Unlock 1.0 period, there was an increase of 266%. This is also recorded as the highest peak in the year so far.
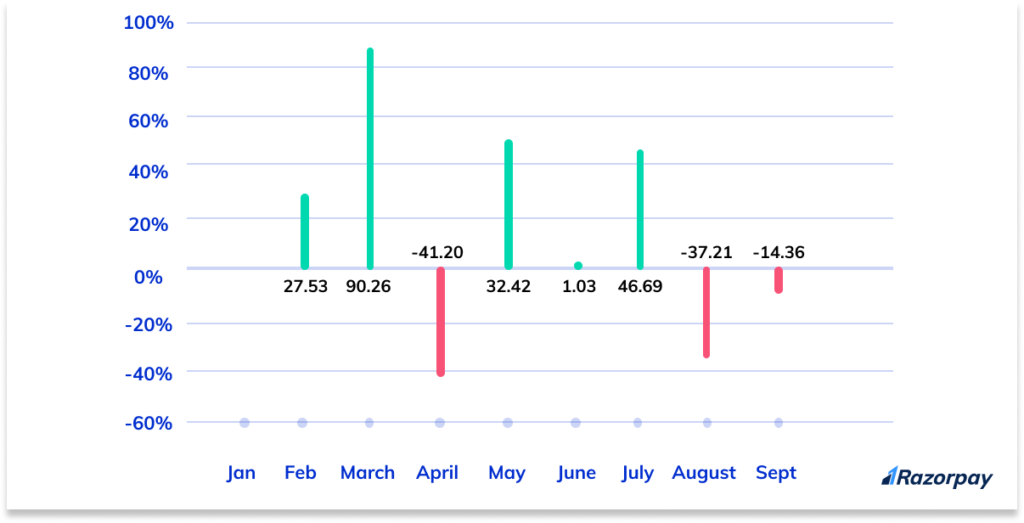
- Refunds issued: The month of July witnessed peak refund counts with a spike of over 46%. The lowest refunds were issued in April as the order counts also took a hit during this lockdown month.
- Preferred mode of payment: Those ordering beauty and personal care are seen using cards as their first choice followed by UPI. Since wallet usage is very low, beauty and personal care businesses planning to incorporate payments via wallets should rethink their decision.
Takeaways – Beauty & personal care
- Non-essential products & services businesses were not operational in March & April, leading to a dip in orders placed. Consumers, however, had their list of requirements ready and hence, the biggest spike of the year was marked in the month of May
- More time at people’s disposal for self care and post lockdown sales can be attributed to a spike in the GMV in post lockdown months
- Saved card functionality offered by businesses was one of the reasons why cards were the most preferred payment modes. Hassles of creating an account on different wallet service providers can be the reason for the lower usage of wallets
What we noticed in the world of electronics
#2021SoFar
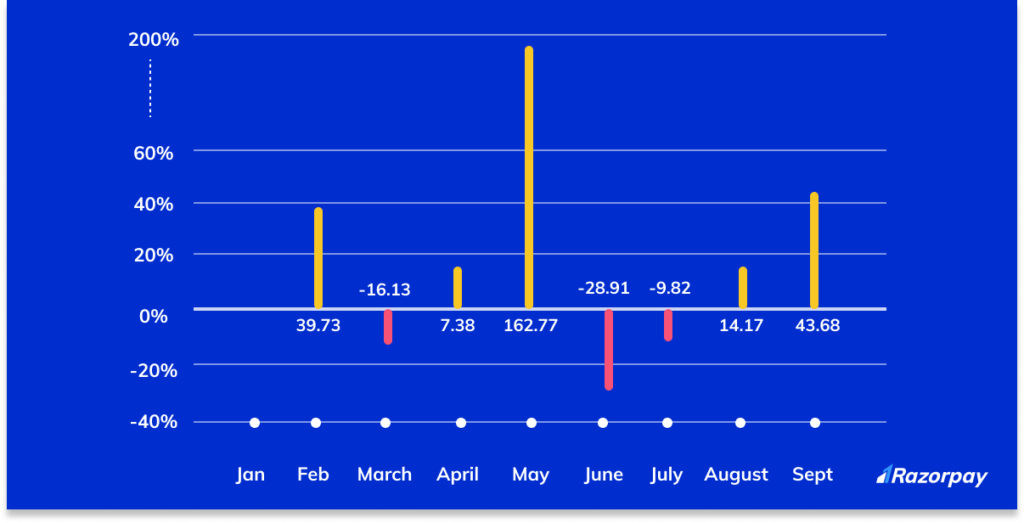
How are Indians placing orders for electrical products?
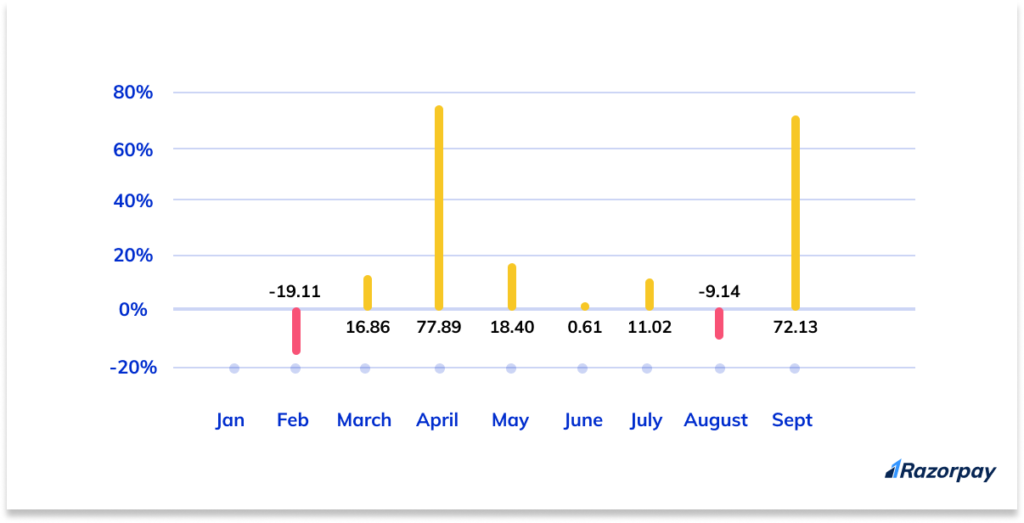
How much did India spend on electrical appliances?
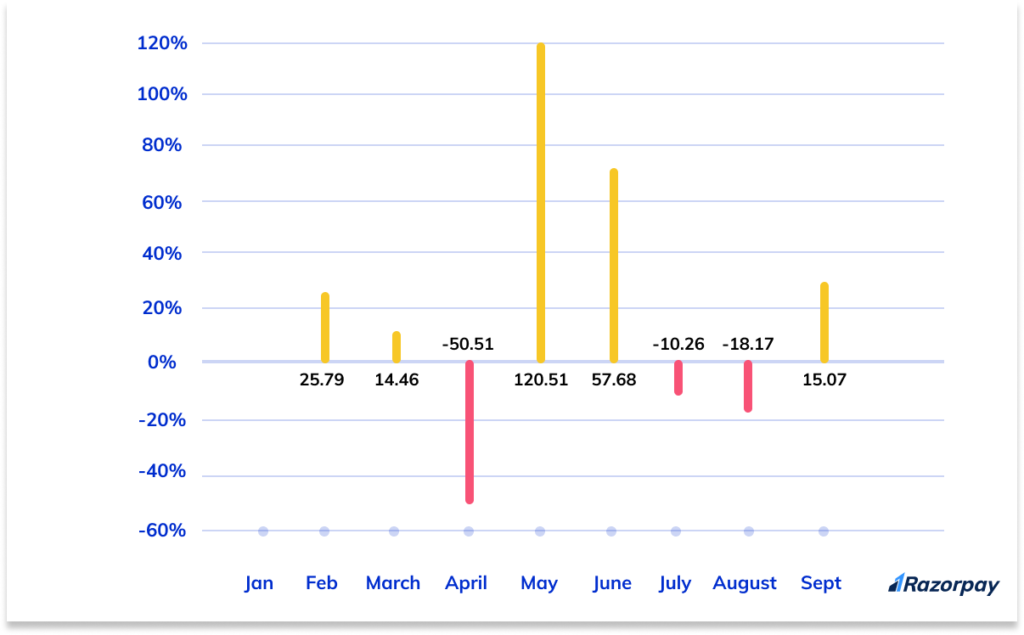
How often did Indian ask for a refund in electronics industry
What mode of payments is most used by electronics shoppers
Key highlights – Electronics
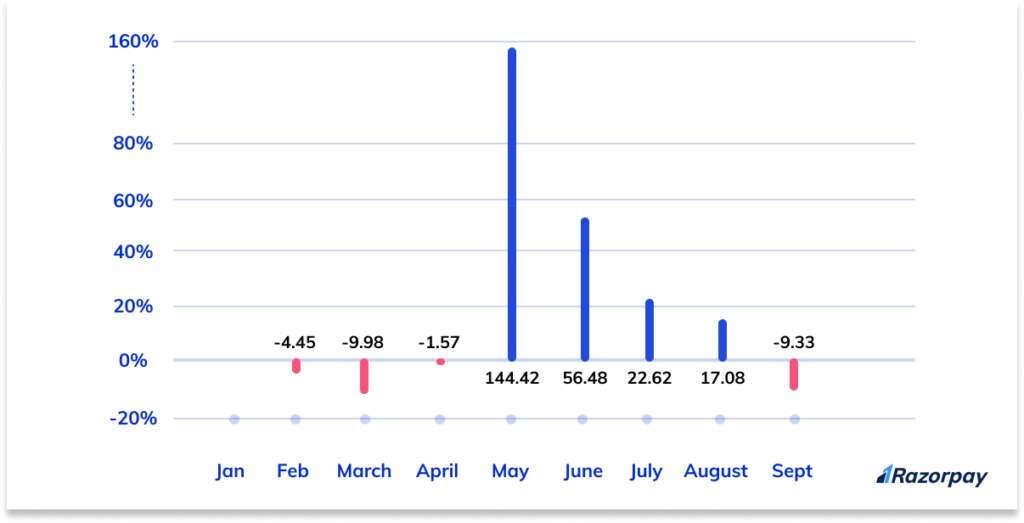
- Orders placed: It looked like May was the month when business was set back to usual with whooping 162% growth. However, the dip that came in June asked entrepreneurs to take a back seat, again. September marked the highest number of orders placed to electronics businesses with a spike of over 43%.
- GMV trend: Highest GMV for electronics businesses was seen in September with a spike of 72% while the major dip was in February, with a dip 0f 19% from the GMV seen in January.
- Refunds issued: For the refunds teams in the electronics businesses, June was the busiest month. Compared to May, there was an increase by 57% in refunds count. On the other hand, the lowest refunds were initiated in April.
- Preferred mode of payment: People looking for electronics items preferred cards as their preferred mode of payment. The second in line was UPI with around 25% of the people choosing it.
Takeaways – Electronics
- Unbearable summers & work from home demands pushed many to place orders when we entered the new world-leading to increased sales in May
- While May saw the maximum number of orders, the GMV was at its peak already in April. It can be assumed that while the order number was lower, the ticket size in April was much higher than what it was for May
- While a lot of people placed orders in May, almost the same number of people also requested a refund. The issues faced by first time buyers can be the case here
What we noticed in the world of fashion & lifestyle
#2021SoFar
How are Indians placing orders for fashion & lifestyle products?
How much did India spend on fashion & lifestyle products
How often did Indians ask for a refund in fashion & lifestyle products
What mode of payments is most used by fashion & lifestyle products shoppers
Key highlights – Fashion & lifestyle
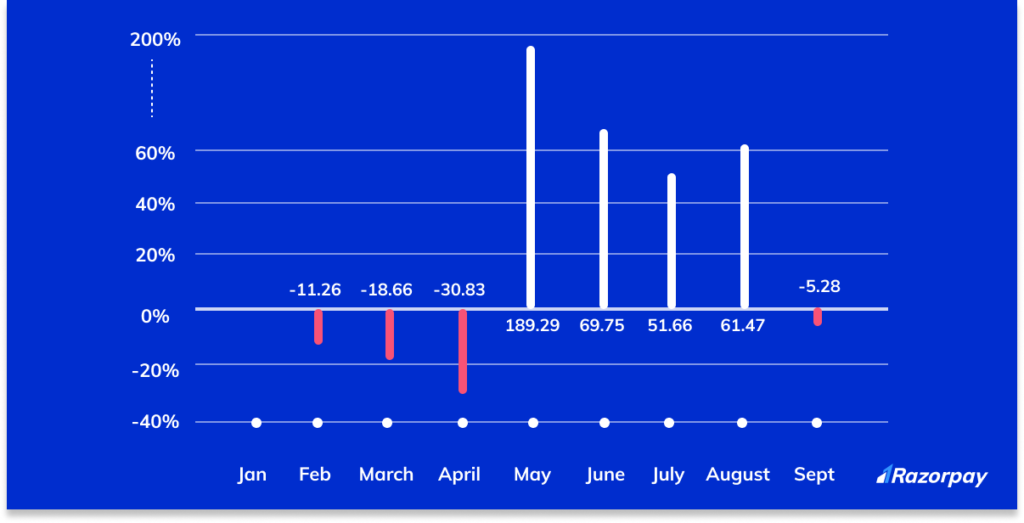
- Orders placed: This industry saw a constant dip in the first quarter of the year. The year saw continuous downfall in the number of orders placed until May. The 5th month came as a relief to the businesses in this domain by bringing a spike of 189% in the number of orders placed.
- GMV trend: Since the industry saw a dip in the first quarter in terms of the order placed, the GMV too, witnessed a dip. April brought with it the lowest GMV for the entire year. However, the number has seen an upward graph since May to August with May itself being the most fruitful month of the year.
- Refunds issued: August experienced the highest number of refund requests for businesses in fashion and lifestyle. Since the number of orders placed in the first quarter of the year was comparatively less, the refunds initiated were also less.
- Preferred mode of payment: Digital money, as it was called once upon a time, has topped the charts for fashion & lifestyle brands too. What stood out is over 15% usage of bank transfers for fashion & lifestyle purchases.
Takeaways – Fashion & lifestyle
- A lot of brands were seen running sales right after the nationwide lockdown while building campaigns around work from home requirements. The upsurge in the orders placed in the month of May is the result of this
- One of the reasons for bulk refunds is the movement of offline shoppers to the online world. Oftentimes, a first time buyer is not very sure of the size and fit and ends up choosing the wrong product, only to end up asking for a refund later
- Since a lot of purchases would have been made using EMIs, cards have been the go-to payment method for consumers here
What we noticed in the world of food & grocery
#2021SoFar
How are Indians placing orders for food & grocery products?
How much did India spend on food & grocery products
How often did Indians ask for a refund in food & grocery products
What mode of payments is most used by fashion & lifestyle products shoppers

Key highlights – Food & grocery
- Orders placed: Even with booming demand during the lockdown months, this industry saw a cumulative decline of around 55% in the orders placed. The orders started picking up in May. We saw the month of September finally reaching near the level of pre-corona numbers in February.
- GMV trends: The GMV trends followed the same pattern as that of orders placed. The months of February to April saw a steady decrease in the GMV value. The GMV picked up in the month of May and has seen a steady increase since then.
- Refunds issued: The refunds in this domain showed a different trend. The month of March saw the highest refunds. The decline in refunds continued from April till June. The month of September saw the refund count reaching the level of February refunds.
- Preferred mode of payment: The most hassle-free mode of payment, UPI is seen as the most preferred mode of payments contributing to over 40% of all the transactions. The second in the row is card payment (38.93%) followed by netbanking (15.37%).
Takeaways – Food & grocery
- The constant rise in orders since May can be because a large number of traditionally offline stores had figured out a way to let people shop and pay online
- GMV saw a continuous upward moving graph here. Clearly, the pandemic brought in a digitalisation wave in the lives of thousands of Indians
- Unlike all the other industries, the refund count in this sector decreased when the orders went high. This happened because groceries and edibles do not have size, fit and colour issues
- UPI, as expected, has topped the charts in this industry, being the easiest way for a first timer to begin using digital payments
What we noticed in the world of home furnishing
#2021SoFar
How are Indians placing orders for home furnishing products
How much did India spend on home furnishing products
How often did Indians ask for a refund in home furnishing products
What mode of payments is most used by home furnishing products shoppers
Key highlights – Home furnishing
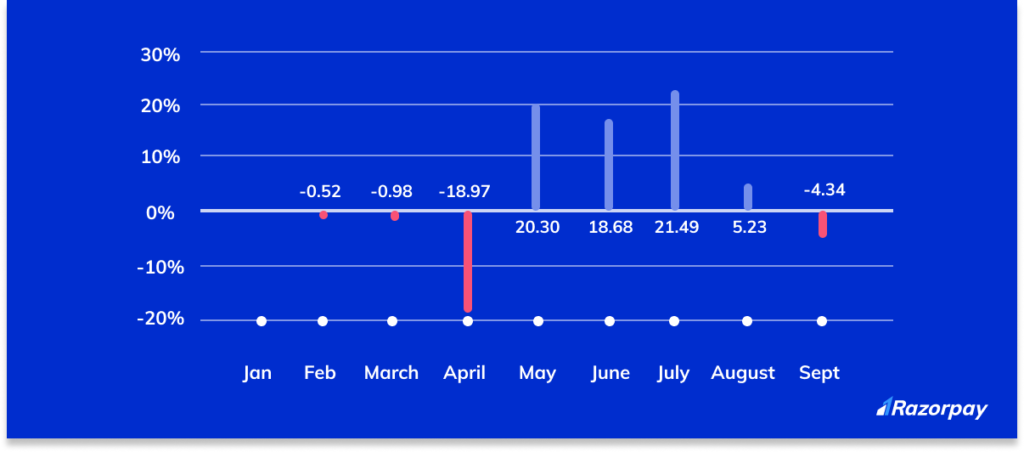
- Orders placed: The months of February and March showed a slight decline in the orders placed. However, April saw the sharpest dip of 18.97%. August saw the highest order count while July witnessed the largest month-on-month increase of 21.49%.
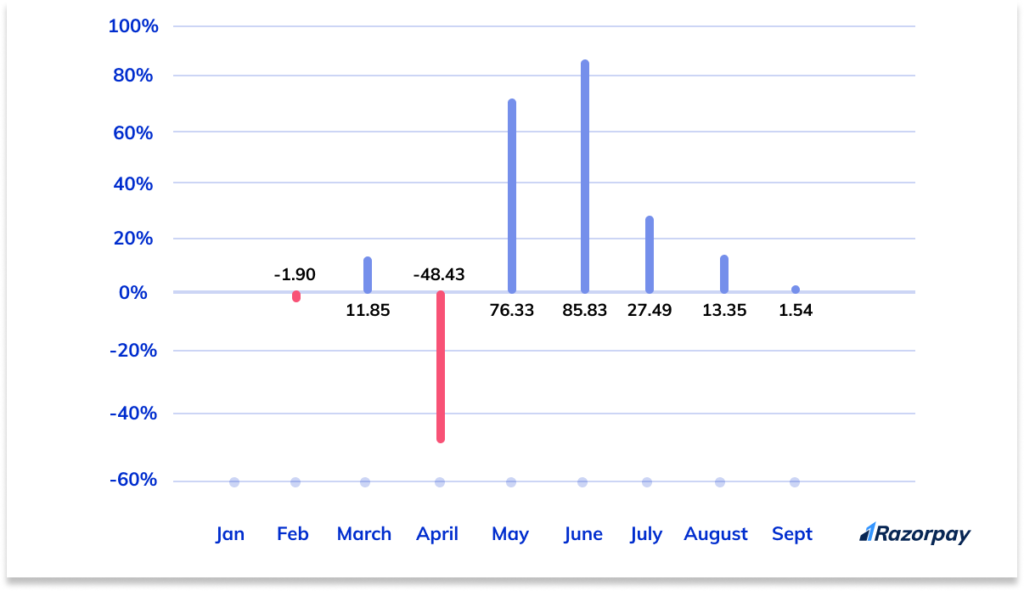
- GMV trends: March, which was a particularly low month for many businesses, saw a rise of 11.85% for this category. April saw the sharpest decline of 48.43%, being the major lockdown month for India. Since May, the category has seen a month-on-month rise in GMV with August and September reporting the highest GMV.
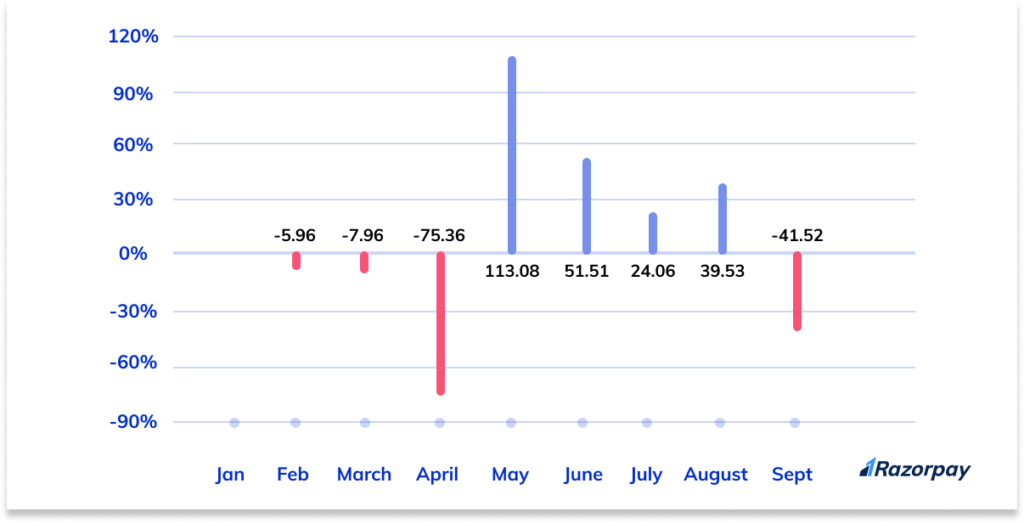
- Refunds issued: The months of March and April encountered sharp declines in refunds, with a month-on-month decrease of 7.96% and 75.36% respectively. April also saw the lowest refund count. May witnessed the sharpest month-on-month increase of almost 113%.
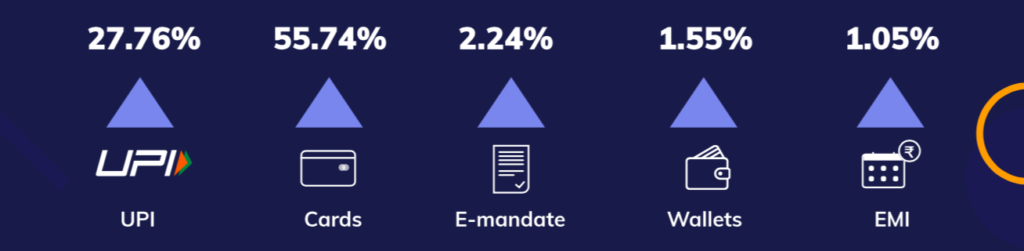
- Preferred mode of payment: Home furnishing, a business expected to have higher cart value saw EMI in its to 5 payment modes. With brands making subscriptions available for furniture, e-mandate is seen topping the charts. However, card remains the first choice for a majority of the audience (55.74%) followed by UPI payments (27.76%).
Takeaways – Home furnishing
- May saw a huge spike in the orders within the industry. One of the reasons, yet again, can be the changes that the pandemic brought into the lives of people – the need for a home office, chair, exercise equipment and so on
- The home furnishing industry comprises goods that have high price value. That makes the month of May and June see a huge spike in the total GMV count
- Home furnishing assets are delicate in many cases because of the material used in manufacturing them. The same thing makes the possibility of damages higher. This can be one of the reasons for the higher refunds in the month of May and June
- Easy access to EMI options through cards has resulted in their increased usage in this sector
Takeaway, way forward & conclusion
E-commerce has become the preferred mode of shopping for most of the Indian consumers, owing to the COVID-19 pandemic. With online payments, easy refunds and no-contact delivery, customers have started seeing this sector in a whole new light.
We saw category-wise e-commerce trends moving in tangent with the economic situation of the country. The lockdown months were hard for most categories with March and April seeing a dip in total orders and GMV. With the implementation of Unlock 2.0, the sectors also started seeing an influx of orders and a higher GMV.
When it comes to e-commerce businesses, there are multiple categories which are now operating on the pre COVID levels of February. Then there are some categories which have surpassed those levels to report their highest-ever GMV in 2021. Overall, we can say that for e-commerce businesses, things are starting to look up.
The businesses in the e-commerce domain picked up pace post-Unlock 2.0. We saw many categories especially Fashion, Grocery and Home Furnishing report a massive month-on-month growth in May.
We have seen UPI payments come up as the most preferred mode of payment, with almost 50% consumers using it for completing transactions. This is followed by card payments most likely because of the saved information on the customer’s go-to shopping website.
For any business, the biggest takeaway from 2021 would be the fact that most consumers are no longer afraid of the digital world, whether it is ordering online or paying online. People are trusting online businesses with big-ticket purchases as well as fast-moving items. It’s a wonderful time to be a dependable e-commerce business.
Please note: All findings in this report are based on transactions held on Razorpay platform.


